Jamaican vs Inupiat Single Father Poverty
COMPARE
Jamaican
Inupiat
Single Father Poverty
Single Father Poverty Comparison
Jamaicans
Inupiat
17.3%
SINGLE FATHER POVERTY
0.3/ 100
METRIC RATING
266th/ 347
METRIC RANK
19.5%
SINGLE FATHER POVERTY
0.0/ 100
METRIC RATING
320th/ 347
METRIC RANK
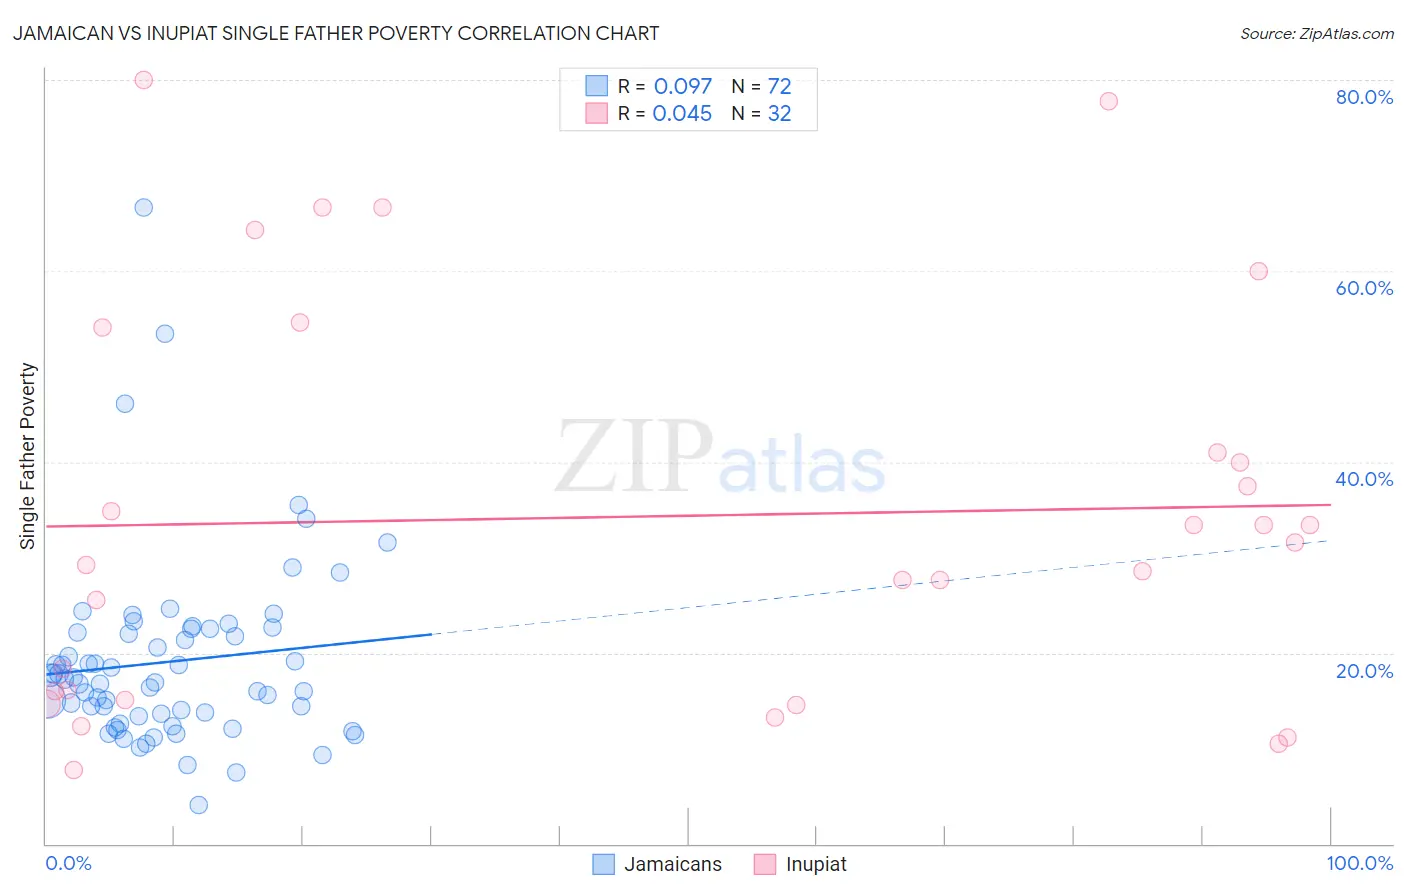
Jamaican vs Inupiat Single Father Poverty Correlation Chart
The statistical analysis conducted on geographies consisting of 295,636,374 people shows a slight positive correlation between the proportion of Jamaicans and poverty level among single fathers in the United States with a correlation coefficient (R) of 0.097 and weighted average of 17.3%. Similarly, the statistical analysis conducted on geographies consisting of 89,997,160 people shows no correlation between the proportion of Inupiat and poverty level among single fathers in the United States with a correlation coefficient (R) of 0.045 and weighted average of 19.5%, a difference of 12.4%.
Single Father Poverty Correlation Summary
| Measurement | Jamaican | Inupiat |
| Minimum | 4.1% | 7.7% |
| Maximum | 66.7% | 80.0% |
| Range | 62.6% | 72.3% |
| Mean | 19.1% | 34.3% |
| Median | 17.1% | 30.4% |
| Interquartile 25% (IQ1) | 13.5% | 15.5% |
| Interquartile 75% (IQ3) | 22.4% | 47.6% |
| Interquartile Range (IQR) | 8.8% | 32.1% |
| Standard Deviation (Sample) | 9.8% | 20.9% |
| Standard Deviation (Population) | 9.8% | 20.6% |
Similar Demographics by Single Father Poverty
Demographics Similar to Jamaicans by Single Father Poverty
In terms of single father poverty, the demographic groups most similar to Jamaicans are Haitian (17.3%, a difference of 0.040%), Slovene (17.3%, a difference of 0.060%), Polish (17.3%, a difference of 0.060%), Immigrants from Caribbean (17.4%, a difference of 0.14%), and Slavic (17.4%, a difference of 0.21%).
| Demographics | Rating | Rank | Single Father Poverty |
| Immigrants | Jamaica | 0.7 /100 | #259 | Tragic 17.2% |
| Spaniards | 0.6 /100 | #260 | Tragic 17.2% |
| Swiss | 0.5 /100 | #261 | Tragic 17.3% |
| Immigrants | Zaire | 0.4 /100 | #262 | Tragic 17.3% |
| Lithuanians | 0.4 /100 | #263 | Tragic 17.3% |
| Slovenes | 0.3 /100 | #264 | Tragic 17.3% |
| Poles | 0.3 /100 | #265 | Tragic 17.3% |
| Jamaicans | 0.3 /100 | #266 | Tragic 17.3% |
| Haitians | 0.3 /100 | #267 | Tragic 17.3% |
| Immigrants | Caribbean | 0.3 /100 | #268 | Tragic 17.4% |
| Slavs | 0.3 /100 | #269 | Tragic 17.4% |
| Indonesians | 0.2 /100 | #270 | Tragic 17.4% |
| French American Indians | 0.2 /100 | #271 | Tragic 17.4% |
| Barbadians | 0.1 /100 | #272 | Tragic 17.5% |
| Italians | 0.1 /100 | #273 | Tragic 17.5% |
Demographics Similar to Inupiat by Single Father Poverty
In terms of single father poverty, the demographic groups most similar to Inupiat are Cherokee (19.6%, a difference of 0.85%), Slovak (19.3%, a difference of 0.91%), Dutch West Indian (19.2%, a difference of 1.4%), Creek (19.8%, a difference of 1.9%), and Dominican (19.1%, a difference of 2.0%).
| Demographics | Rating | Rank | Single Father Poverty |
| Potawatomi | 0.0 /100 | #313 | Tragic 18.9% |
| Delaware | 0.0 /100 | #314 | Tragic 18.9% |
| Chickasaw | 0.0 /100 | #315 | Tragic 19.0% |
| Osage | 0.0 /100 | #316 | Tragic 19.0% |
| Dominicans | 0.0 /100 | #317 | Tragic 19.1% |
| Dutch West Indians | 0.0 /100 | #318 | Tragic 19.2% |
| Slovaks | 0.0 /100 | #319 | Tragic 19.3% |
| Inupiat | 0.0 /100 | #320 | Tragic 19.5% |
| Cherokee | 0.0 /100 | #321 | Tragic 19.6% |
| Creek | 0.0 /100 | #322 | Tragic 19.8% |
| Pennsylvania Germans | 0.0 /100 | #323 | Tragic 20.0% |
| Americans | 0.0 /100 | #324 | Tragic 20.1% |
| Blacks/African Americans | 0.0 /100 | #325 | Tragic 20.4% |
| Immigrants | Yemen | 0.0 /100 | #326 | Tragic 20.6% |
| Choctaw | 0.0 /100 | #327 | Tragic 20.7% |