Zimbabwean vs Immigrants from Portugal Single Father Poverty
COMPARE
Zimbabwean
Immigrants from Portugal
Single Father Poverty
Single Father Poverty Comparison
Zimbabweans
Immigrants from Portugal
15.6%
SINGLE FATHER POVERTY
98.1/ 100
METRIC RATING
98th/ 347
METRIC RANK
15.9%
SINGLE FATHER POVERTY
89.7/ 100
METRIC RATING
132nd/ 347
METRIC RANK
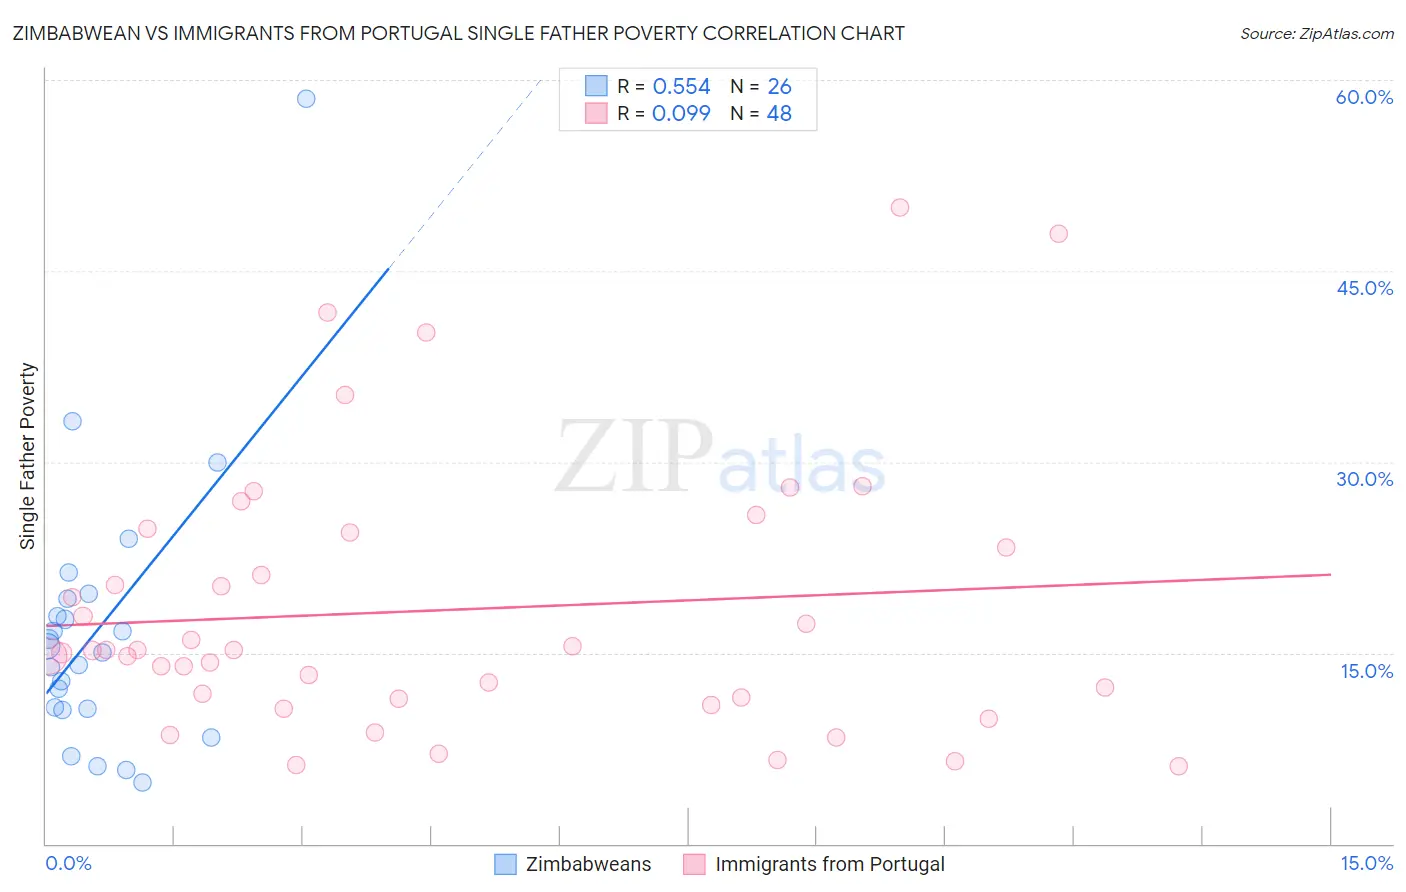
Zimbabwean vs Immigrants from Portugal Single Father Poverty Correlation Chart
The statistical analysis conducted on geographies consisting of 64,763,564 people shows a substantial positive correlation between the proportion of Zimbabweans and poverty level among single fathers in the United States with a correlation coefficient (R) of 0.554 and weighted average of 15.6%. Similarly, the statistical analysis conducted on geographies consisting of 145,028,103 people shows a slight positive correlation between the proportion of Immigrants from Portugal and poverty level among single fathers in the United States with a correlation coefficient (R) of 0.099 and weighted average of 15.9%, a difference of 2.1%.
Single Father Poverty Correlation Summary
| Measurement | Zimbabwean | Immigrants from Portugal |
| Minimum | 4.8% | 6.1% |
| Maximum | 58.6% | 50.0% |
| Range | 53.8% | 43.9% |
| Mean | 16.8% | 18.4% |
| Median | 15.3% | 15.2% |
| Interquartile 25% (IQ1) | 10.6% | 11.4% |
| Interquartile 75% (IQ3) | 19.3% | 23.9% |
| Interquartile Range (IQR) | 8.7% | 12.5% |
| Standard Deviation (Sample) | 11.0% | 10.6% |
| Standard Deviation (Population) | 10.7% | 10.5% |
Similar Demographics by Single Father Poverty
Demographics Similar to Zimbabweans by Single Father Poverty
In terms of single father poverty, the demographic groups most similar to Zimbabweans are Yaqui (15.6%, a difference of 0.010%), Immigrants from Belgium (15.6%, a difference of 0.020%), Immigrants from Kazakhstan (15.6%, a difference of 0.030%), Immigrants from Uruguay (15.6%, a difference of 0.080%), and Basque (15.5%, a difference of 0.22%).
| Demographics | Rating | Rank | Single Father Poverty |
| Immigrants | Romania | 98.6 /100 | #91 | Exceptional 15.5% |
| Immigrants | Serbia | 98.5 /100 | #92 | Exceptional 15.5% |
| Basques | 98.4 /100 | #93 | Exceptional 15.5% |
| Immigrants | Uruguay | 98.2 /100 | #94 | Exceptional 15.6% |
| Immigrants | Kazakhstan | 98.2 /100 | #95 | Exceptional 15.6% |
| Immigrants | Belgium | 98.1 /100 | #96 | Exceptional 15.6% |
| Yaqui | 98.1 /100 | #97 | Exceptional 15.6% |
| Zimbabweans | 98.1 /100 | #98 | Exceptional 15.6% |
| Immigrants | Middle Africa | 97.4 /100 | #99 | Exceptional 15.6% |
| Immigrants | Chile | 96.9 /100 | #100 | Exceptional 15.7% |
| Fijians | 96.8 /100 | #101 | Exceptional 15.7% |
| Chileans | 96.4 /100 | #102 | Exceptional 15.7% |
| South American Indians | 96.2 /100 | #103 | Exceptional 15.7% |
| Australians | 96.1 /100 | #104 | Exceptional 15.7% |
| Immigrants | Australia | 96.1 /100 | #105 | Exceptional 15.7% |
Demographics Similar to Immigrants from Portugal by Single Father Poverty
In terms of single father poverty, the demographic groups most similar to Immigrants from Portugal are Immigrants from Syria (15.9%, a difference of 0.020%), Norwegian (15.9%, a difference of 0.060%), Nicaraguan (15.9%, a difference of 0.060%), Immigrants from West Indies (15.9%, a difference of 0.14%), and Immigrants from South America (15.9%, a difference of 0.14%).
| Demographics | Rating | Rank | Single Father Poverty |
| Iraqis | 91.2 /100 | #125 | Exceptional 15.9% |
| Hmong | 91.1 /100 | #126 | Exceptional 15.9% |
| Immigrants | Liberia | 91.1 /100 | #127 | Exceptional 15.9% |
| Immigrants | Nigeria | 90.8 /100 | #128 | Exceptional 15.9% |
| Immigrants | West Indies | 90.8 /100 | #129 | Exceptional 15.9% |
| Norwegians | 90.2 /100 | #130 | Exceptional 15.9% |
| Nicaraguans | 90.1 /100 | #131 | Exceptional 15.9% |
| Immigrants | Portugal | 89.7 /100 | #132 | Excellent 15.9% |
| Immigrants | Syria | 89.5 /100 | #133 | Excellent 15.9% |
| Immigrants | South America | 88.5 /100 | #134 | Excellent 15.9% |
| Immigrants | Sri Lanka | 88.2 /100 | #135 | Excellent 15.9% |
| Cypriots | 87.5 /100 | #136 | Excellent 15.9% |
| Immigrants | Azores | 87.2 /100 | #137 | Excellent 15.9% |
| Central Americans | 87.1 /100 | #138 | Excellent 16.0% |
| South Americans | 85.9 /100 | #139 | Excellent 16.0% |