Zimbabwean vs Immigrants from Micronesia Single Father Poverty
COMPARE
Zimbabwean
Immigrants from Micronesia
Single Father Poverty
Single Father Poverty Comparison
Zimbabweans
Immigrants from Micronesia
15.6%
SINGLE FATHER POVERTY
98.1/ 100
METRIC RATING
98th/ 347
METRIC RANK
18.6%
SINGLE FATHER POVERTY
0.0/ 100
METRIC RATING
309th/ 347
METRIC RANK
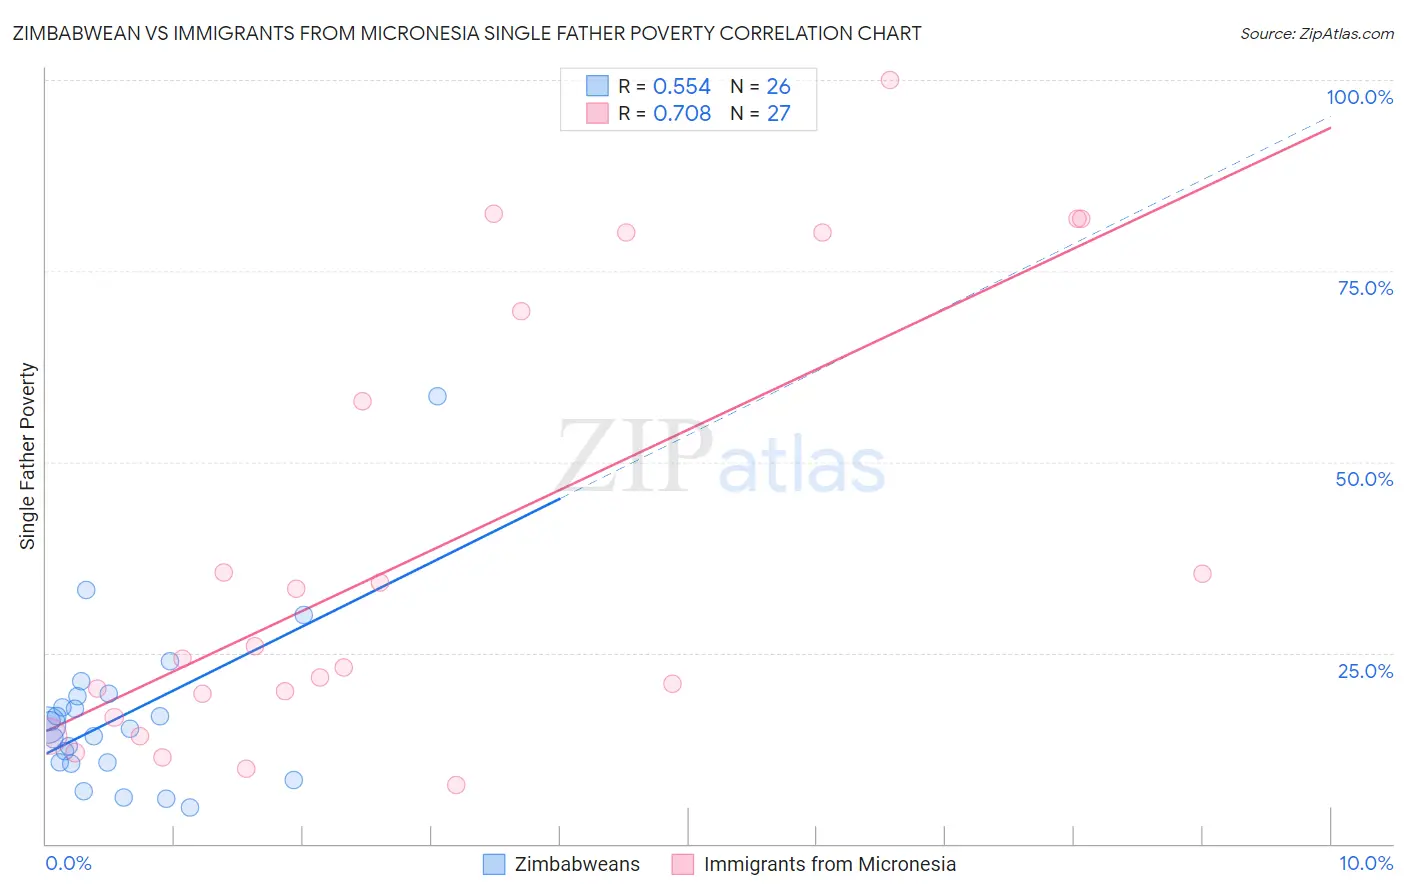
Zimbabwean vs Immigrants from Micronesia Single Father Poverty Correlation Chart
The statistical analysis conducted on geographies consisting of 64,763,564 people shows a substantial positive correlation between the proportion of Zimbabweans and poverty level among single fathers in the United States with a correlation coefficient (R) of 0.554 and weighted average of 15.6%. Similarly, the statistical analysis conducted on geographies consisting of 57,566,995 people shows a strong positive correlation between the proportion of Immigrants from Micronesia and poverty level among single fathers in the United States with a correlation coefficient (R) of 0.708 and weighted average of 18.6%, a difference of 19.3%.
Single Father Poverty Correlation Summary
| Measurement | Zimbabwean | Immigrants from Micronesia |
| Minimum | 4.8% | 7.7% |
| Maximum | 58.6% | 100.0% |
| Range | 53.8% | 92.3% |
| Mean | 16.8% | 38.3% |
| Median | 15.3% | 24.3% |
| Interquartile 25% (IQ1) | 10.6% | 16.6% |
| Interquartile 75% (IQ3) | 19.3% | 69.8% |
| Interquartile Range (IQR) | 8.7% | 53.2% |
| Standard Deviation (Sample) | 11.0% | 28.7% |
| Standard Deviation (Population) | 10.7% | 28.2% |
Similar Demographics by Single Father Poverty
Demographics Similar to Zimbabweans by Single Father Poverty
In terms of single father poverty, the demographic groups most similar to Zimbabweans are Yaqui (15.6%, a difference of 0.010%), Immigrants from Belgium (15.6%, a difference of 0.020%), Immigrants from Kazakhstan (15.6%, a difference of 0.030%), Immigrants from Uruguay (15.6%, a difference of 0.080%), and Basque (15.5%, a difference of 0.22%).
| Demographics | Rating | Rank | Single Father Poverty |
| Immigrants | Romania | 98.6 /100 | #91 | Exceptional 15.5% |
| Immigrants | Serbia | 98.5 /100 | #92 | Exceptional 15.5% |
| Basques | 98.4 /100 | #93 | Exceptional 15.5% |
| Immigrants | Uruguay | 98.2 /100 | #94 | Exceptional 15.6% |
| Immigrants | Kazakhstan | 98.2 /100 | #95 | Exceptional 15.6% |
| Immigrants | Belgium | 98.1 /100 | #96 | Exceptional 15.6% |
| Yaqui | 98.1 /100 | #97 | Exceptional 15.6% |
| Zimbabweans | 98.1 /100 | #98 | Exceptional 15.6% |
| Immigrants | Middle Africa | 97.4 /100 | #99 | Exceptional 15.6% |
| Immigrants | Chile | 96.9 /100 | #100 | Exceptional 15.7% |
| Fijians | 96.8 /100 | #101 | Exceptional 15.7% |
| Chileans | 96.4 /100 | #102 | Exceptional 15.7% |
| South American Indians | 96.2 /100 | #103 | Exceptional 15.7% |
| Australians | 96.1 /100 | #104 | Exceptional 15.7% |
| Immigrants | Australia | 96.1 /100 | #105 | Exceptional 15.7% |
Demographics Similar to Immigrants from Micronesia by Single Father Poverty
In terms of single father poverty, the demographic groups most similar to Immigrants from Micronesia are Ottawa (18.6%, a difference of 0.11%), French Canadian (18.6%, a difference of 0.13%), Scotch-Irish (18.6%, a difference of 0.17%), Blackfeet (18.5%, a difference of 0.39%), and Ute (18.5%, a difference of 0.44%).
| Demographics | Rating | Rank | Single Father Poverty |
| Comanche | 0.0 /100 | #302 | Tragic 18.5% |
| Celtics | 0.0 /100 | #303 | Tragic 18.5% |
| Ute | 0.0 /100 | #304 | Tragic 18.5% |
| Blackfeet | 0.0 /100 | #305 | Tragic 18.5% |
| Scotch-Irish | 0.0 /100 | #306 | Tragic 18.6% |
| French Canadians | 0.0 /100 | #307 | Tragic 18.6% |
| Ottawa | 0.0 /100 | #308 | Tragic 18.6% |
| Immigrants | Micronesia | 0.0 /100 | #309 | Tragic 18.6% |
| Chippewa | 0.0 /100 | #310 | Tragic 18.8% |
| Immigrants | Nonimmigrants | 0.0 /100 | #311 | Tragic 18.8% |
| Immigrants | Dominica | 0.0 /100 | #312 | Tragic 18.9% |
| Potawatomi | 0.0 /100 | #313 | Tragic 18.9% |
| Delaware | 0.0 /100 | #314 | Tragic 18.9% |
| Chickasaw | 0.0 /100 | #315 | Tragic 19.0% |
| Osage | 0.0 /100 | #316 | Tragic 19.0% |