Dutch vs Inupiat Single Father Poverty
COMPARE
Dutch
Inupiat
Single Father Poverty
Single Father Poverty Comparison
Dutch
Inupiat
17.8%
SINGLE FATHER POVERTY
0.0/ 100
METRIC RATING
282nd/ 347
METRIC RANK
19.5%
SINGLE FATHER POVERTY
0.0/ 100
METRIC RATING
320th/ 347
METRIC RANK
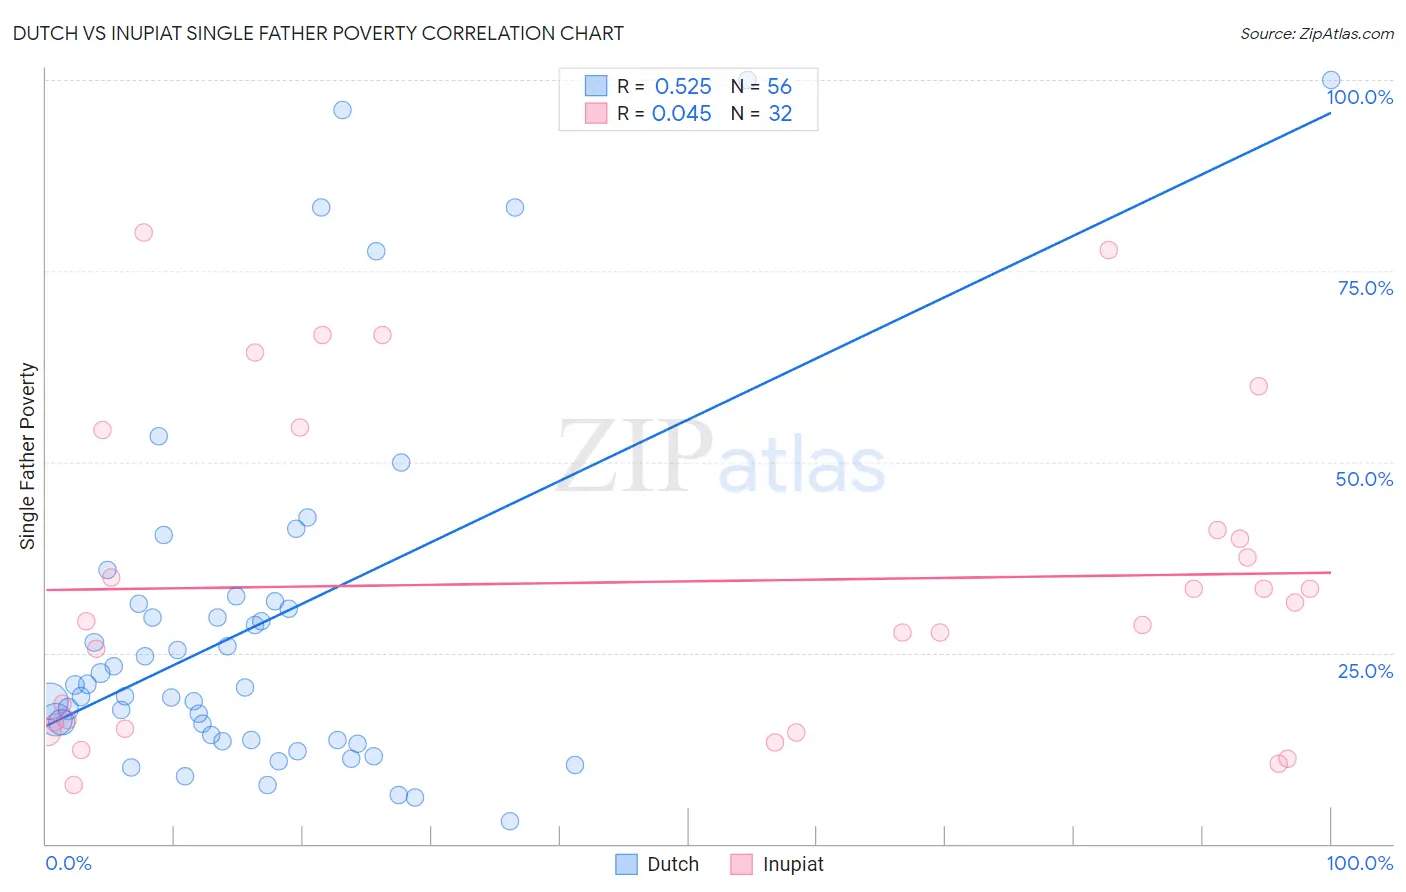
Dutch vs Inupiat Single Father Poverty Correlation Chart
The statistical analysis conducted on geographies consisting of 399,453,553 people shows a substantial positive correlation between the proportion of Dutch and poverty level among single fathers in the United States with a correlation coefficient (R) of 0.525 and weighted average of 17.8%. Similarly, the statistical analysis conducted on geographies consisting of 89,997,160 people shows no correlation between the proportion of Inupiat and poverty level among single fathers in the United States with a correlation coefficient (R) of 0.045 and weighted average of 19.5%, a difference of 9.4%.
Single Father Poverty Correlation Summary
| Measurement | Dutch | Inupiat |
| Minimum | 2.9% | 7.7% |
| Maximum | 100.0% | 80.0% |
| Range | 97.1% | 72.3% |
| Mean | 28.9% | 34.3% |
| Median | 20.7% | 30.4% |
| Interquartile 25% (IQ1) | 13.6% | 15.5% |
| Interquartile 75% (IQ3) | 31.6% | 47.6% |
| Interquartile Range (IQR) | 18.0% | 32.1% |
| Standard Deviation (Sample) | 24.1% | 20.9% |
| Standard Deviation (Population) | 23.9% | 20.6% |
Similar Demographics by Single Father Poverty
Demographics Similar to Dutch by Single Father Poverty
In terms of single father poverty, the demographic groups most similar to Dutch are English (17.8%, a difference of 0.0%), Alsatian (17.8%, a difference of 0.10%), Welsh (17.8%, a difference of 0.11%), Scottish (17.7%, a difference of 0.32%), and Iroquois (17.7%, a difference of 0.37%).
| Demographics | Rating | Rank | Single Father Poverty |
| British West Indians | 0.0 /100 | #275 | Tragic 17.7% |
| German Russians | 0.0 /100 | #276 | Tragic 17.7% |
| Lebanese | 0.0 /100 | #277 | Tragic 17.7% |
| Germans | 0.0 /100 | #278 | Tragic 17.7% |
| Iroquois | 0.0 /100 | #279 | Tragic 17.7% |
| Scottish | 0.0 /100 | #280 | Tragic 17.7% |
| English | 0.0 /100 | #281 | Tragic 17.8% |
| Dutch | 0.0 /100 | #282 | Tragic 17.8% |
| Alsatians | 0.0 /100 | #283 | Tragic 17.8% |
| Welsh | 0.0 /100 | #284 | Tragic 17.8% |
| Immigrants | Lebanon | 0.0 /100 | #285 | Tragic 17.9% |
| Immigrants | North Macedonia | 0.0 /100 | #286 | Tragic 17.9% |
| Carpatho Rusyns | 0.0 /100 | #287 | Tragic 18.0% |
| Bahamians | 0.0 /100 | #288 | Tragic 18.0% |
| Irish | 0.0 /100 | #289 | Tragic 18.0% |
Demographics Similar to Inupiat by Single Father Poverty
In terms of single father poverty, the demographic groups most similar to Inupiat are Cherokee (19.6%, a difference of 0.85%), Slovak (19.3%, a difference of 0.91%), Dutch West Indian (19.2%, a difference of 1.4%), Creek (19.8%, a difference of 1.9%), and Dominican (19.1%, a difference of 2.0%).
| Demographics | Rating | Rank | Single Father Poverty |
| Potawatomi | 0.0 /100 | #313 | Tragic 18.9% |
| Delaware | 0.0 /100 | #314 | Tragic 18.9% |
| Chickasaw | 0.0 /100 | #315 | Tragic 19.0% |
| Osage | 0.0 /100 | #316 | Tragic 19.0% |
| Dominicans | 0.0 /100 | #317 | Tragic 19.1% |
| Dutch West Indians | 0.0 /100 | #318 | Tragic 19.2% |
| Slovaks | 0.0 /100 | #319 | Tragic 19.3% |
| Inupiat | 0.0 /100 | #320 | Tragic 19.5% |
| Cherokee | 0.0 /100 | #321 | Tragic 19.6% |
| Creek | 0.0 /100 | #322 | Tragic 19.8% |
| Pennsylvania Germans | 0.0 /100 | #323 | Tragic 20.0% |
| Americans | 0.0 /100 | #324 | Tragic 20.1% |
| Blacks/African Americans | 0.0 /100 | #325 | Tragic 20.4% |
| Immigrants | Yemen | 0.0 /100 | #326 | Tragic 20.6% |
| Choctaw | 0.0 /100 | #327 | Tragic 20.7% |