Zimbabwean vs Immigrants from Norway Single Father Poverty
COMPARE
Zimbabwean
Immigrants from Norway
Single Father Poverty
Single Father Poverty Comparison
Zimbabweans
Immigrants from Norway
15.6%
SINGLE FATHER POVERTY
98.1/ 100
METRIC RATING
98th/ 347
METRIC RANK
16.8%
SINGLE FATHER POVERTY
6.5/ 100
METRIC RATING
224th/ 347
METRIC RANK
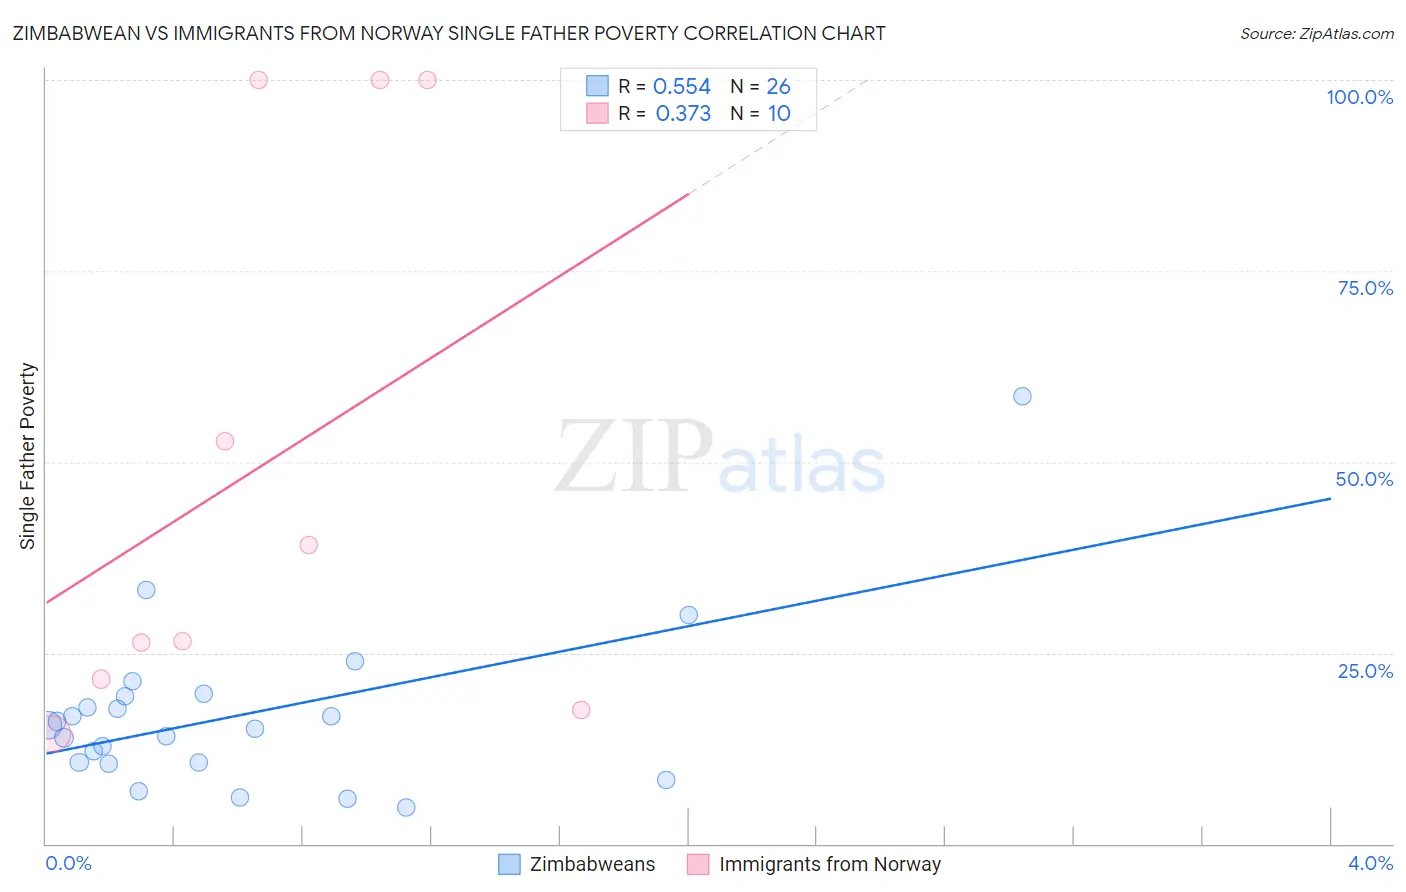
Zimbabwean vs Immigrants from Norway Single Father Poverty Correlation Chart
The statistical analysis conducted on geographies consisting of 64,763,564 people shows a substantial positive correlation between the proportion of Zimbabweans and poverty level among single fathers in the United States with a correlation coefficient (R) of 0.554 and weighted average of 15.6%. Similarly, the statistical analysis conducted on geographies consisting of 101,345,089 people shows a mild positive correlation between the proportion of Immigrants from Norway and poverty level among single fathers in the United States with a correlation coefficient (R) of 0.373 and weighted average of 16.8%, a difference of 7.6%.
Single Father Poverty Correlation Summary
| Measurement | Zimbabwean | Immigrants from Norway |
| Minimum | 4.8% | 14.5% |
| Maximum | 58.6% | 100.0% |
| Range | 53.8% | 85.5% |
| Mean | 16.8% | 49.8% |
| Median | 15.3% | 32.8% |
| Interquartile 25% (IQ1) | 10.6% | 21.6% |
| Interquartile 75% (IQ3) | 19.3% | 100.0% |
| Interquartile Range (IQR) | 8.7% | 78.4% |
| Standard Deviation (Sample) | 11.0% | 36.3% |
| Standard Deviation (Population) | 10.7% | 34.4% |
Similar Demographics by Single Father Poverty
Demographics Similar to Zimbabweans by Single Father Poverty
In terms of single father poverty, the demographic groups most similar to Zimbabweans are Yaqui (15.6%, a difference of 0.010%), Immigrants from Belgium (15.6%, a difference of 0.020%), Immigrants from Kazakhstan (15.6%, a difference of 0.030%), Immigrants from Uruguay (15.6%, a difference of 0.080%), and Basque (15.5%, a difference of 0.22%).
| Demographics | Rating | Rank | Single Father Poverty |
| Immigrants | Romania | 98.6 /100 | #91 | Exceptional 15.5% |
| Immigrants | Serbia | 98.5 /100 | #92 | Exceptional 15.5% |
| Basques | 98.4 /100 | #93 | Exceptional 15.5% |
| Immigrants | Uruguay | 98.2 /100 | #94 | Exceptional 15.6% |
| Immigrants | Kazakhstan | 98.2 /100 | #95 | Exceptional 15.6% |
| Immigrants | Belgium | 98.1 /100 | #96 | Exceptional 15.6% |
| Yaqui | 98.1 /100 | #97 | Exceptional 15.6% |
| Zimbabweans | 98.1 /100 | #98 | Exceptional 15.6% |
| Immigrants | Middle Africa | 97.4 /100 | #99 | Exceptional 15.6% |
| Immigrants | Chile | 96.9 /100 | #100 | Exceptional 15.7% |
| Fijians | 96.8 /100 | #101 | Exceptional 15.7% |
| Chileans | 96.4 /100 | #102 | Exceptional 15.7% |
| South American Indians | 96.2 /100 | #103 | Exceptional 15.7% |
| Australians | 96.1 /100 | #104 | Exceptional 15.7% |
| Immigrants | Australia | 96.1 /100 | #105 | Exceptional 15.7% |
Demographics Similar to Immigrants from Norway by Single Father Poverty
In terms of single father poverty, the demographic groups most similar to Immigrants from Norway are Menominee (16.8%, a difference of 0.020%), Hispanic or Latino (16.8%, a difference of 0.070%), Immigrants from Austria (16.8%, a difference of 0.080%), British (16.8%, a difference of 0.16%), and Belgian (16.8%, a difference of 0.23%).
| Demographics | Rating | Rank | Single Father Poverty |
| Cheyenne | 9.3 /100 | #217 | Tragic 16.7% |
| Immigrants | Uganda | 8.6 /100 | #218 | Tragic 16.7% |
| Immigrants | Ghana | 8.1 /100 | #219 | Tragic 16.7% |
| Immigrants | Denmark | 8.1 /100 | #220 | Tragic 16.7% |
| Immigrants | Greece | 8.1 /100 | #221 | Tragic 16.7% |
| Immigrants | Spain | 8.0 /100 | #222 | Tragic 16.7% |
| Immigrants | Austria | 7.0 /100 | #223 | Tragic 16.8% |
| Immigrants | Norway | 6.5 /100 | #224 | Tragic 16.8% |
| Menominee | 6.4 /100 | #225 | Tragic 16.8% |
| Hispanics or Latinos | 6.1 /100 | #226 | Tragic 16.8% |
| British | 5.6 /100 | #227 | Tragic 16.8% |
| Belgians | 5.3 /100 | #228 | Tragic 16.8% |
| Israelis | 4.6 /100 | #229 | Tragic 16.8% |
| Immigrants | Trinidad and Tobago | 4.5 /100 | #230 | Tragic 16.8% |
| Spanish Americans | 3.7 /100 | #231 | Tragic 16.9% |