Zimbabwean vs Taiwanese Single Father Poverty
COMPARE
Zimbabwean
Taiwanese
Single Father Poverty
Single Father Poverty Comparison
Zimbabweans
Taiwanese
15.6%
SINGLE FATHER POVERTY
98.1/ 100
METRIC RATING
98th/ 347
METRIC RANK
14.3%
SINGLE FATHER POVERTY
100.0/ 100
METRIC RATING
22nd/ 347
METRIC RANK
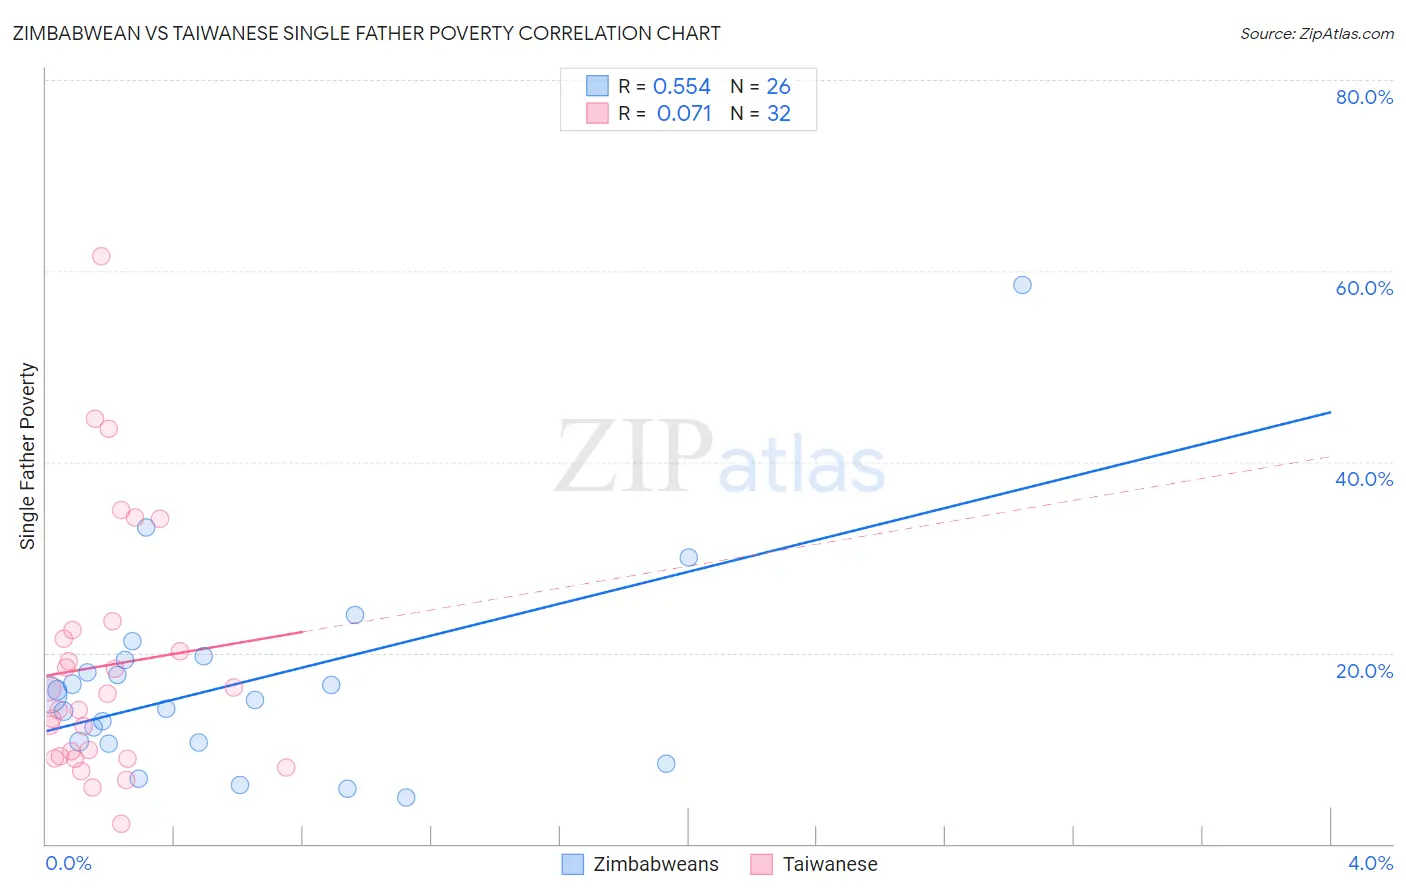
Zimbabwean vs Taiwanese Single Father Poverty Correlation Chart
The statistical analysis conducted on geographies consisting of 64,763,564 people shows a substantial positive correlation between the proportion of Zimbabweans and poverty level among single fathers in the United States with a correlation coefficient (R) of 0.554 and weighted average of 15.6%. Similarly, the statistical analysis conducted on geographies consisting of 30,651,469 people shows a slight positive correlation between the proportion of Taiwanese and poverty level among single fathers in the United States with a correlation coefficient (R) of 0.071 and weighted average of 14.3%, a difference of 8.8%.
Single Father Poverty Correlation Summary
| Measurement | Zimbabwean | Taiwanese |
| Minimum | 4.8% | 2.0% |
| Maximum | 58.6% | 61.5% |
| Range | 53.8% | 59.5% |
| Mean | 16.8% | 18.6% |
| Median | 15.3% | 14.9% |
| Interquartile 25% (IQ1) | 10.6% | 9.0% |
| Interquartile 75% (IQ3) | 19.3% | 21.9% |
| Interquartile Range (IQR) | 8.7% | 12.9% |
| Standard Deviation (Sample) | 11.0% | 13.2% |
| Standard Deviation (Population) | 10.7% | 13.0% |
Similar Demographics by Single Father Poverty
Demographics Similar to Zimbabweans by Single Father Poverty
In terms of single father poverty, the demographic groups most similar to Zimbabweans are Yaqui (15.6%, a difference of 0.010%), Immigrants from Belgium (15.6%, a difference of 0.020%), Immigrants from Kazakhstan (15.6%, a difference of 0.030%), Immigrants from Uruguay (15.6%, a difference of 0.080%), and Basque (15.5%, a difference of 0.22%).
| Demographics | Rating | Rank | Single Father Poverty |
| Immigrants | Romania | 98.6 /100 | #91 | Exceptional 15.5% |
| Immigrants | Serbia | 98.5 /100 | #92 | Exceptional 15.5% |
| Basques | 98.4 /100 | #93 | Exceptional 15.5% |
| Immigrants | Uruguay | 98.2 /100 | #94 | Exceptional 15.6% |
| Immigrants | Kazakhstan | 98.2 /100 | #95 | Exceptional 15.6% |
| Immigrants | Belgium | 98.1 /100 | #96 | Exceptional 15.6% |
| Yaqui | 98.1 /100 | #97 | Exceptional 15.6% |
| Zimbabweans | 98.1 /100 | #98 | Exceptional 15.6% |
| Immigrants | Middle Africa | 97.4 /100 | #99 | Exceptional 15.6% |
| Immigrants | Chile | 96.9 /100 | #100 | Exceptional 15.7% |
| Fijians | 96.8 /100 | #101 | Exceptional 15.7% |
| Chileans | 96.4 /100 | #102 | Exceptional 15.7% |
| South American Indians | 96.2 /100 | #103 | Exceptional 15.7% |
| Australians | 96.1 /100 | #104 | Exceptional 15.7% |
| Immigrants | Australia | 96.1 /100 | #105 | Exceptional 15.7% |
Demographics Similar to Taiwanese by Single Father Poverty
In terms of single father poverty, the demographic groups most similar to Taiwanese are Immigrants from Egypt (14.4%, a difference of 0.21%), Immigrants from South Eastern Asia (14.4%, a difference of 0.21%), Iranian (14.4%, a difference of 0.25%), Immigrants from Afghanistan (14.3%, a difference of 0.33%), and Immigrants from Singapore (14.3%, a difference of 0.43%).
| Demographics | Rating | Rank | Single Father Poverty |
| Sri Lankans | 100.0 /100 | #15 | Exceptional 14.2% |
| Immigrants | Iran | 100.0 /100 | #16 | Exceptional 14.2% |
| Immigrants | Hong Kong | 100.0 /100 | #17 | Exceptional 14.2% |
| Soviet Union | 100.0 /100 | #18 | Exceptional 14.3% |
| Immigrants | Iraq | 100.0 /100 | #19 | Exceptional 14.3% |
| Immigrants | Singapore | 100.0 /100 | #20 | Exceptional 14.3% |
| Immigrants | Afghanistan | 100.0 /100 | #21 | Exceptional 14.3% |
| Taiwanese | 100.0 /100 | #22 | Exceptional 14.3% |
| Immigrants | Egypt | 100.0 /100 | #23 | Exceptional 14.4% |
| Immigrants | South Eastern Asia | 100.0 /100 | #24 | Exceptional 14.4% |
| Iranians | 100.0 /100 | #25 | Exceptional 14.4% |
| Spanish American Indians | 100.0 /100 | #26 | Exceptional 14.4% |
| Nepalese | 100.0 /100 | #27 | Exceptional 14.4% |
| Immigrants | South Central Asia | 100.0 /100 | #28 | Exceptional 14.5% |
| Somalis | 100.0 /100 | #29 | Exceptional 14.5% |