Estonian vs Inupiat Single Father Poverty
COMPARE
Estonian
Inupiat
Single Father Poverty
Single Father Poverty Comparison
Estonians
Inupiat
16.2%
SINGLE FATHER POVERTY
56.7/ 100
METRIC RATING
161st/ 347
METRIC RANK
19.5%
SINGLE FATHER POVERTY
0.0/ 100
METRIC RATING
320th/ 347
METRIC RANK
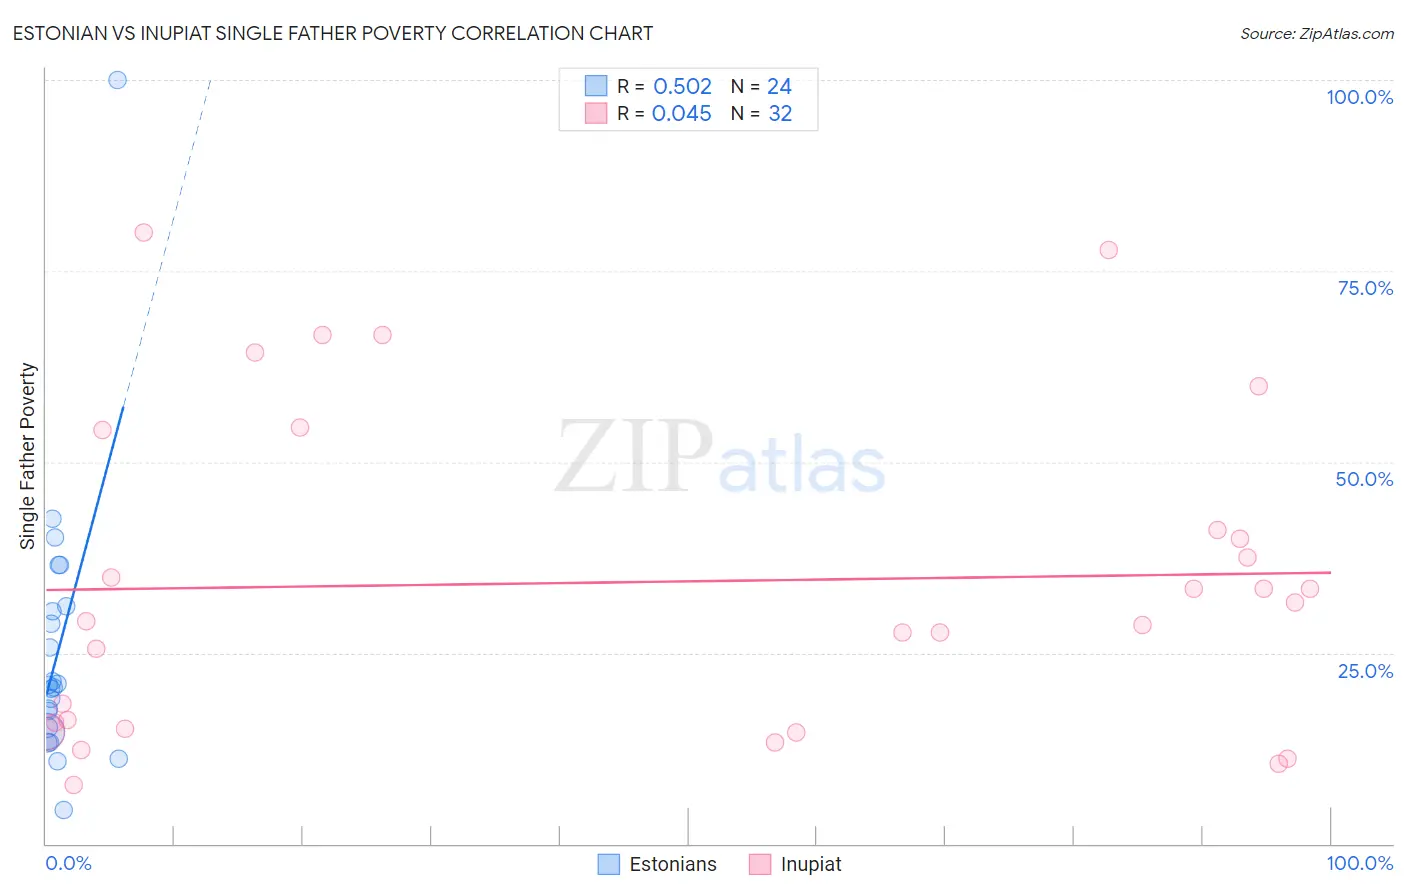
Estonian vs Inupiat Single Father Poverty Correlation Chart
The statistical analysis conducted on geographies consisting of 107,284,896 people shows a substantial positive correlation between the proportion of Estonians and poverty level among single fathers in the United States with a correlation coefficient (R) of 0.502 and weighted average of 16.2%. Similarly, the statistical analysis conducted on geographies consisting of 89,997,160 people shows no correlation between the proportion of Inupiat and poverty level among single fathers in the United States with a correlation coefficient (R) of 0.045 and weighted average of 19.5%, a difference of 19.9%.
Single Father Poverty Correlation Summary
| Measurement | Estonian | Inupiat |
| Minimum | 4.3% | 7.7% |
| Maximum | 100.0% | 80.0% |
| Range | 95.7% | 72.3% |
| Mean | 25.5% | 34.3% |
| Median | 20.6% | 30.4% |
| Interquartile 25% (IQ1) | 14.9% | 15.5% |
| Interquartile 75% (IQ3) | 30.7% | 47.6% |
| Interquartile Range (IQR) | 15.8% | 32.1% |
| Standard Deviation (Sample) | 18.7% | 20.9% |
| Standard Deviation (Population) | 18.3% | 20.6% |
Similar Demographics by Single Father Poverty
Demographics Similar to Estonians by Single Father Poverty
In terms of single father poverty, the demographic groups most similar to Estonians are Ugandan (16.3%, a difference of 0.040%), Immigrants from Costa Rica (16.3%, a difference of 0.040%), Guyanese (16.3%, a difference of 0.070%), Immigrants from Bangladesh (16.3%, a difference of 0.070%), and Immigrants from Europe (16.3%, a difference of 0.080%).
| Demographics | Rating | Rank | Single Father Poverty |
| Mexicans | 70.1 /100 | #154 | Good 16.1% |
| Immigrants | Nicaragua | 67.8 /100 | #155 | Good 16.2% |
| Immigrants | Jordan | 66.0 /100 | #156 | Good 16.2% |
| Immigrants | Czechoslovakia | 62.8 /100 | #157 | Good 16.2% |
| Portuguese | 62.3 /100 | #158 | Good 16.2% |
| Belizeans | 59.9 /100 | #159 | Average 16.2% |
| Immigrants | Sudan | 59.8 /100 | #160 | Average 16.2% |
| Estonians | 56.7 /100 | #161 | Average 16.2% |
| Ugandans | 55.9 /100 | #162 | Average 16.3% |
| Immigrants | Costa Rica | 55.7 /100 | #163 | Average 16.3% |
| Guyanese | 55.2 /100 | #164 | Average 16.3% |
| Immigrants | Bangladesh | 55.1 /100 | #165 | Average 16.3% |
| Immigrants | Europe | 54.8 /100 | #166 | Average 16.3% |
| Yugoslavians | 53.9 /100 | #167 | Average 16.3% |
| Costa Ricans | 53.6 /100 | #168 | Average 16.3% |
Demographics Similar to Inupiat by Single Father Poverty
In terms of single father poverty, the demographic groups most similar to Inupiat are Cherokee (19.6%, a difference of 0.85%), Slovak (19.3%, a difference of 0.91%), Dutch West Indian (19.2%, a difference of 1.4%), Creek (19.8%, a difference of 1.9%), and Dominican (19.1%, a difference of 2.0%).
| Demographics | Rating | Rank | Single Father Poverty |
| Potawatomi | 0.0 /100 | #313 | Tragic 18.9% |
| Delaware | 0.0 /100 | #314 | Tragic 18.9% |
| Chickasaw | 0.0 /100 | #315 | Tragic 19.0% |
| Osage | 0.0 /100 | #316 | Tragic 19.0% |
| Dominicans | 0.0 /100 | #317 | Tragic 19.1% |
| Dutch West Indians | 0.0 /100 | #318 | Tragic 19.2% |
| Slovaks | 0.0 /100 | #319 | Tragic 19.3% |
| Inupiat | 0.0 /100 | #320 | Tragic 19.5% |
| Cherokee | 0.0 /100 | #321 | Tragic 19.6% |
| Creek | 0.0 /100 | #322 | Tragic 19.8% |
| Pennsylvania Germans | 0.0 /100 | #323 | Tragic 20.0% |
| Americans | 0.0 /100 | #324 | Tragic 20.1% |
| Blacks/African Americans | 0.0 /100 | #325 | Tragic 20.4% |
| Immigrants | Yemen | 0.0 /100 | #326 | Tragic 20.6% |
| Choctaw | 0.0 /100 | #327 | Tragic 20.7% |