Zimbabwean vs Inupiat Female Unemployment
COMPARE
Zimbabwean
Inupiat
Female Unemployment
Female Unemployment Comparison
Zimbabweans
Inupiat
4.8%
FEMALE UNEMPLOYMENT
99.7/ 100
METRIC RATING
34th/ 347
METRIC RANK
8.2%
FEMALE UNEMPLOYMENT
0.0/ 100
METRIC RATING
341st/ 347
METRIC RANK
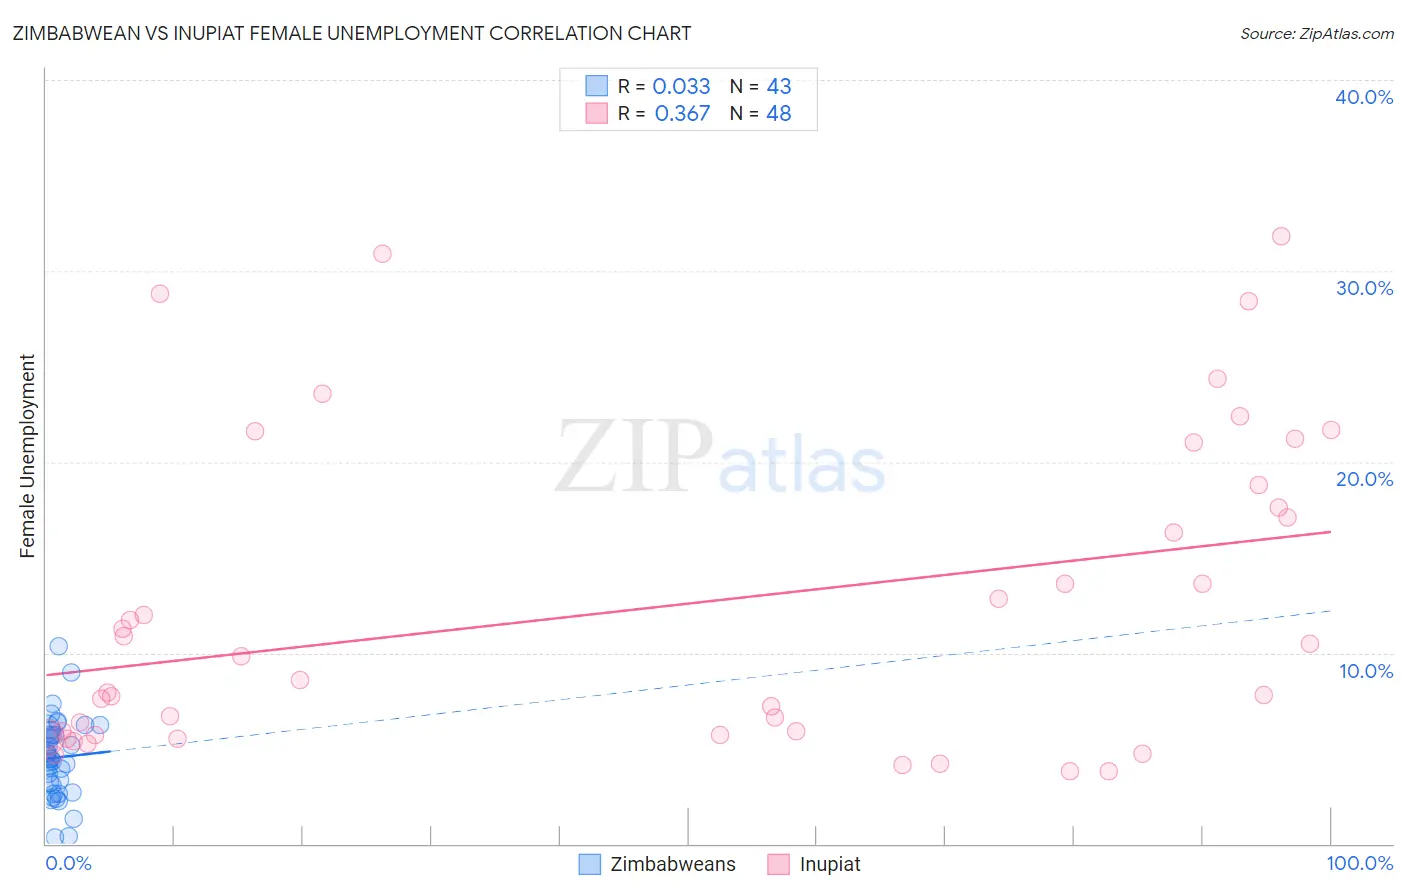
Zimbabwean vs Inupiat Female Unemployment Correlation Chart
The statistical analysis conducted on geographies consisting of 69,190,722 people shows no correlation between the proportion of Zimbabweans and unemploymnet rate among females in the United States with a correlation coefficient (R) of 0.033 and weighted average of 4.8%. Similarly, the statistical analysis conducted on geographies consisting of 96,139,159 people shows a mild positive correlation between the proportion of Inupiat and unemploymnet rate among females in the United States with a correlation coefficient (R) of 0.367 and weighted average of 8.2%, a difference of 70.3%.
Female Unemployment Correlation Summary
| Measurement | Zimbabwean | Inupiat |
| Minimum | 0.30% | 3.8% |
| Maximum | 10.3% | 31.8% |
| Range | 10.0% | 28.0% |
| Mean | 4.5% | 12.4% |
| Median | 4.5% | 9.2% |
| Interquartile 25% (IQ1) | 3.1% | 5.7% |
| Interquartile 75% (IQ3) | 5.7% | 18.2% |
| Interquartile Range (IQR) | 2.6% | 12.5% |
| Standard Deviation (Sample) | 2.0% | 8.1% |
| Standard Deviation (Population) | 2.0% | 8.0% |
Similar Demographics by Female Unemployment
Demographics Similar to Zimbabweans by Female Unemployment
In terms of female unemployment, the demographic groups most similar to Zimbabweans are Czechoslovakian (4.8%, a difference of 0.030%), French Canadian (4.8%, a difference of 0.060%), Yugoslavian (4.8%, a difference of 0.21%), Slovak (4.8%, a difference of 0.54%), and Pennsylvania German (4.8%, a difference of 0.57%).
| Demographics | Rating | Rank | Female Unemployment |
| British | 99.9 /100 | #27 | Exceptional 4.7% |
| Irish | 99.9 /100 | #28 | Exceptional 4.7% |
| Cypriots | 99.9 /100 | #29 | Exceptional 4.7% |
| Lithuanians | 99.8 /100 | #30 | Exceptional 4.7% |
| Sudanese | 99.8 /100 | #31 | Exceptional 4.8% |
| Slovaks | 99.8 /100 | #32 | Exceptional 4.8% |
| Czechoslovakians | 99.7 /100 | #33 | Exceptional 4.8% |
| Zimbabweans | 99.7 /100 | #34 | Exceptional 4.8% |
| French Canadians | 99.7 /100 | #35 | Exceptional 4.8% |
| Yugoslavians | 99.7 /100 | #36 | Exceptional 4.8% |
| Pennsylvania Germans | 99.6 /100 | #37 | Exceptional 4.8% |
| Northern Europeans | 99.6 /100 | #38 | Exceptional 4.8% |
| Scotch-Irish | 99.6 /100 | #39 | Exceptional 4.8% |
| French | 99.6 /100 | #40 | Exceptional 4.8% |
| Tongans | 99.5 /100 | #41 | Exceptional 4.8% |
Demographics Similar to Inupiat by Female Unemployment
In terms of female unemployment, the demographic groups most similar to Inupiat are Hopi (8.1%, a difference of 0.76%), Puerto Rican (8.3%, a difference of 2.2%), Immigrants from Yemen (7.8%, a difference of 4.1%), Tohono O'odham (7.7%, a difference of 5.3%), and Arapaho (8.8%, a difference of 7.7%).
| Demographics | Rating | Rank | Female Unemployment |
| Menominee | 0.0 /100 | #333 | Tragic 7.0% |
| Immigrants | Armenia | 0.0 /100 | #334 | Tragic 7.1% |
| Dominicans | 0.0 /100 | #335 | Tragic 7.2% |
| Immigrants | Dominican Republic | 0.0 /100 | #336 | Tragic 7.2% |
| Navajo | 0.0 /100 | #337 | Tragic 7.3% |
| Tohono O'odham | 0.0 /100 | #338 | Tragic 7.7% |
| Immigrants | Yemen | 0.0 /100 | #339 | Tragic 7.8% |
| Hopi | 0.0 /100 | #340 | Tragic 8.1% |
| Inupiat | 0.0 /100 | #341 | Tragic 8.2% |
| Puerto Ricans | 0.0 /100 | #342 | Tragic 8.3% |
| Arapaho | 0.0 /100 | #343 | Tragic 8.8% |
| Pima | 0.0 /100 | #344 | Tragic 9.3% |
| Yuman | 0.0 /100 | #345 | Tragic 9.6% |
| Yup'ik | 0.0 /100 | #346 | Tragic 10.9% |
| Crow | 0.0 /100 | #347 | Tragic 12.1% |