Zimbabwean vs Tohono O'odham Single Father Poverty
COMPARE
Zimbabwean
Tohono O'odham
Single Father Poverty
Single Father Poverty Comparison
Zimbabweans
Tohono O'odham
15.6%
SINGLE FATHER POVERTY
98.1/ 100
METRIC RATING
98th/ 347
METRIC RANK
22.0%
SINGLE FATHER POVERTY
0.0/ 100
METRIC RATING
332nd/ 347
METRIC RANK
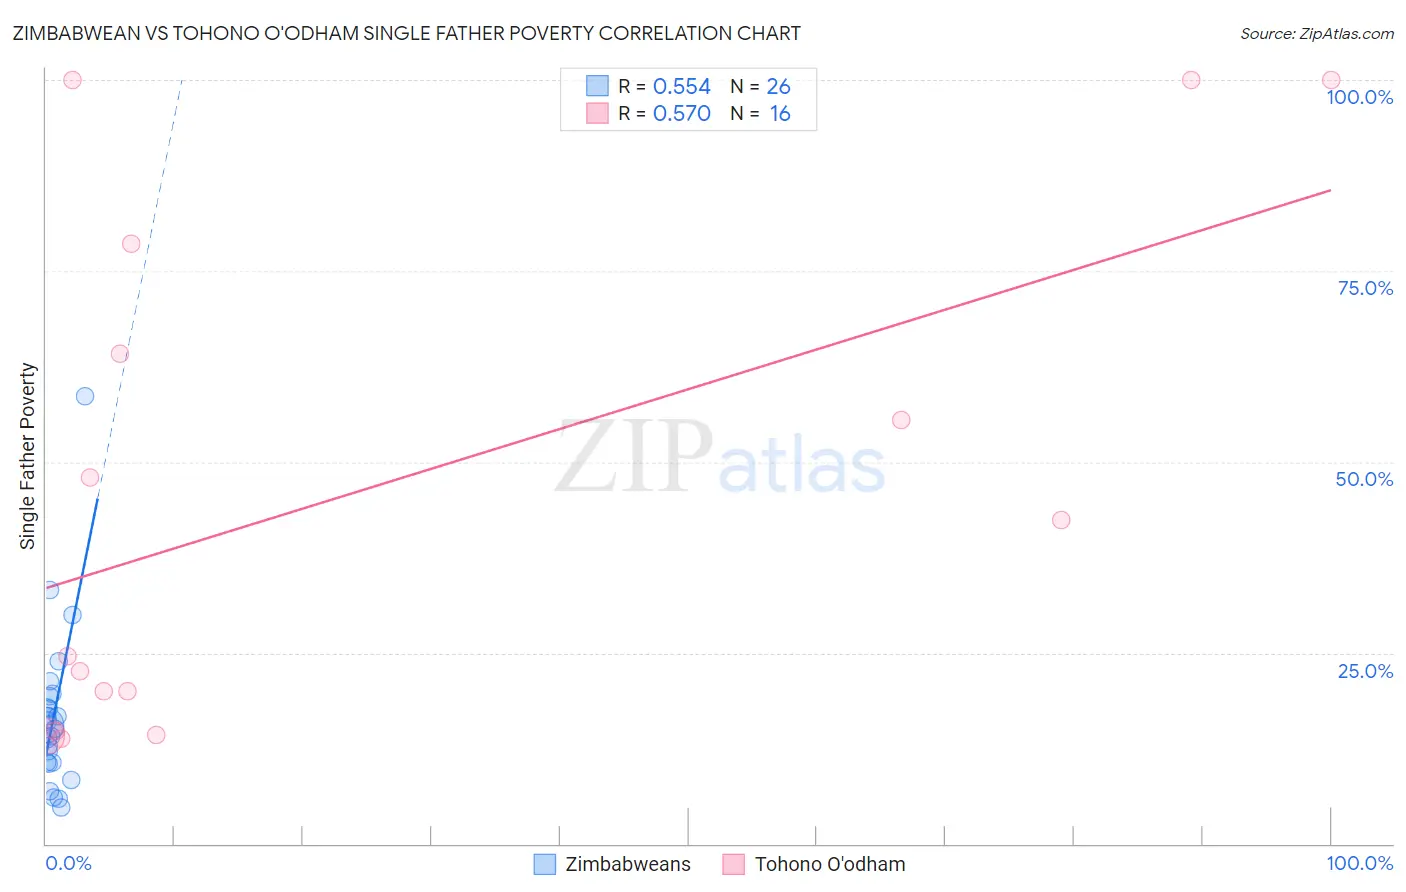
Zimbabwean vs Tohono O'odham Single Father Poverty Correlation Chart
The statistical analysis conducted on geographies consisting of 64,763,564 people shows a substantial positive correlation between the proportion of Zimbabweans and poverty level among single fathers in the United States with a correlation coefficient (R) of 0.554 and weighted average of 15.6%. Similarly, the statistical analysis conducted on geographies consisting of 55,933,384 people shows a substantial positive correlation between the proportion of Tohono O'odham and poverty level among single fathers in the United States with a correlation coefficient (R) of 0.570 and weighted average of 22.0%, a difference of 41.2%.
Single Father Poverty Correlation Summary
| Measurement | Zimbabwean | Tohono O'odham |
| Minimum | 4.8% | 13.8% |
| Maximum | 58.6% | 100.0% |
| Range | 53.8% | 86.2% |
| Mean | 16.8% | 45.8% |
| Median | 15.3% | 33.5% |
| Interquartile 25% (IQ1) | 10.6% | 17.4% |
| Interquartile 75% (IQ3) | 19.3% | 71.4% |
| Interquartile Range (IQR) | 8.7% | 54.0% |
| Standard Deviation (Sample) | 11.0% | 33.3% |
| Standard Deviation (Population) | 10.7% | 32.3% |
Similar Demographics by Single Father Poverty
Demographics Similar to Zimbabweans by Single Father Poverty
In terms of single father poverty, the demographic groups most similar to Zimbabweans are Yaqui (15.6%, a difference of 0.010%), Immigrants from Belgium (15.6%, a difference of 0.020%), Immigrants from Kazakhstan (15.6%, a difference of 0.030%), Immigrants from Uruguay (15.6%, a difference of 0.080%), and Basque (15.5%, a difference of 0.22%).
| Demographics | Rating | Rank | Single Father Poverty |
| Immigrants | Romania | 98.6 /100 | #91 | Exceptional 15.5% |
| Immigrants | Serbia | 98.5 /100 | #92 | Exceptional 15.5% |
| Basques | 98.4 /100 | #93 | Exceptional 15.5% |
| Immigrants | Uruguay | 98.2 /100 | #94 | Exceptional 15.6% |
| Immigrants | Kazakhstan | 98.2 /100 | #95 | Exceptional 15.6% |
| Immigrants | Belgium | 98.1 /100 | #96 | Exceptional 15.6% |
| Yaqui | 98.1 /100 | #97 | Exceptional 15.6% |
| Zimbabweans | 98.1 /100 | #98 | Exceptional 15.6% |
| Immigrants | Middle Africa | 97.4 /100 | #99 | Exceptional 15.6% |
| Immigrants | Chile | 96.9 /100 | #100 | Exceptional 15.7% |
| Fijians | 96.8 /100 | #101 | Exceptional 15.7% |
| Chileans | 96.4 /100 | #102 | Exceptional 15.7% |
| South American Indians | 96.2 /100 | #103 | Exceptional 15.7% |
| Australians | 96.1 /100 | #104 | Exceptional 15.7% |
| Immigrants | Australia | 96.1 /100 | #105 | Exceptional 15.7% |
Demographics Similar to Tohono O'odham by Single Father Poverty
In terms of single father poverty, the demographic groups most similar to Tohono O'odham are Central American Indian (21.7%, a difference of 1.5%), Native/Alaskan (22.4%, a difference of 1.7%), Paiute (21.6%, a difference of 1.8%), Kiowa (22.5%, a difference of 2.1%), and Colville (21.4%, a difference of 3.1%).
| Demographics | Rating | Rank | Single Father Poverty |
| Blacks/African Americans | 0.0 /100 | #325 | Tragic 20.4% |
| Immigrants | Yemen | 0.0 /100 | #326 | Tragic 20.6% |
| Choctaw | 0.0 /100 | #327 | Tragic 20.7% |
| Pueblo | 0.0 /100 | #328 | Tragic 21.1% |
| Colville | 0.0 /100 | #329 | Tragic 21.4% |
| Paiute | 0.0 /100 | #330 | Tragic 21.6% |
| Central American Indians | 0.0 /100 | #331 | Tragic 21.7% |
| Tohono O'odham | 0.0 /100 | #332 | Tragic 22.0% |
| Natives/Alaskans | 0.0 /100 | #333 | Tragic 22.4% |
| Kiowa | 0.0 /100 | #334 | Tragic 22.5% |
| Shoshone | 0.0 /100 | #335 | Tragic 22.9% |
| Cajuns | 0.0 /100 | #336 | Tragic 23.1% |
| Sioux | 0.0 /100 | #337 | Tragic 23.9% |
| Arapaho | 0.0 /100 | #338 | Tragic 24.0% |
| Apache | 0.0 /100 | #339 | Tragic 24.2% |