Zimbabwean vs Immigrants from Zaire Single Father Poverty
COMPARE
Zimbabwean
Immigrants from Zaire
Single Father Poverty
Single Father Poverty Comparison
Zimbabweans
Immigrants from Zaire
15.6%
SINGLE FATHER POVERTY
98.1/ 100
METRIC RATING
98th/ 347
METRIC RANK
17.3%
SINGLE FATHER POVERTY
0.4/ 100
METRIC RATING
262nd/ 347
METRIC RANK
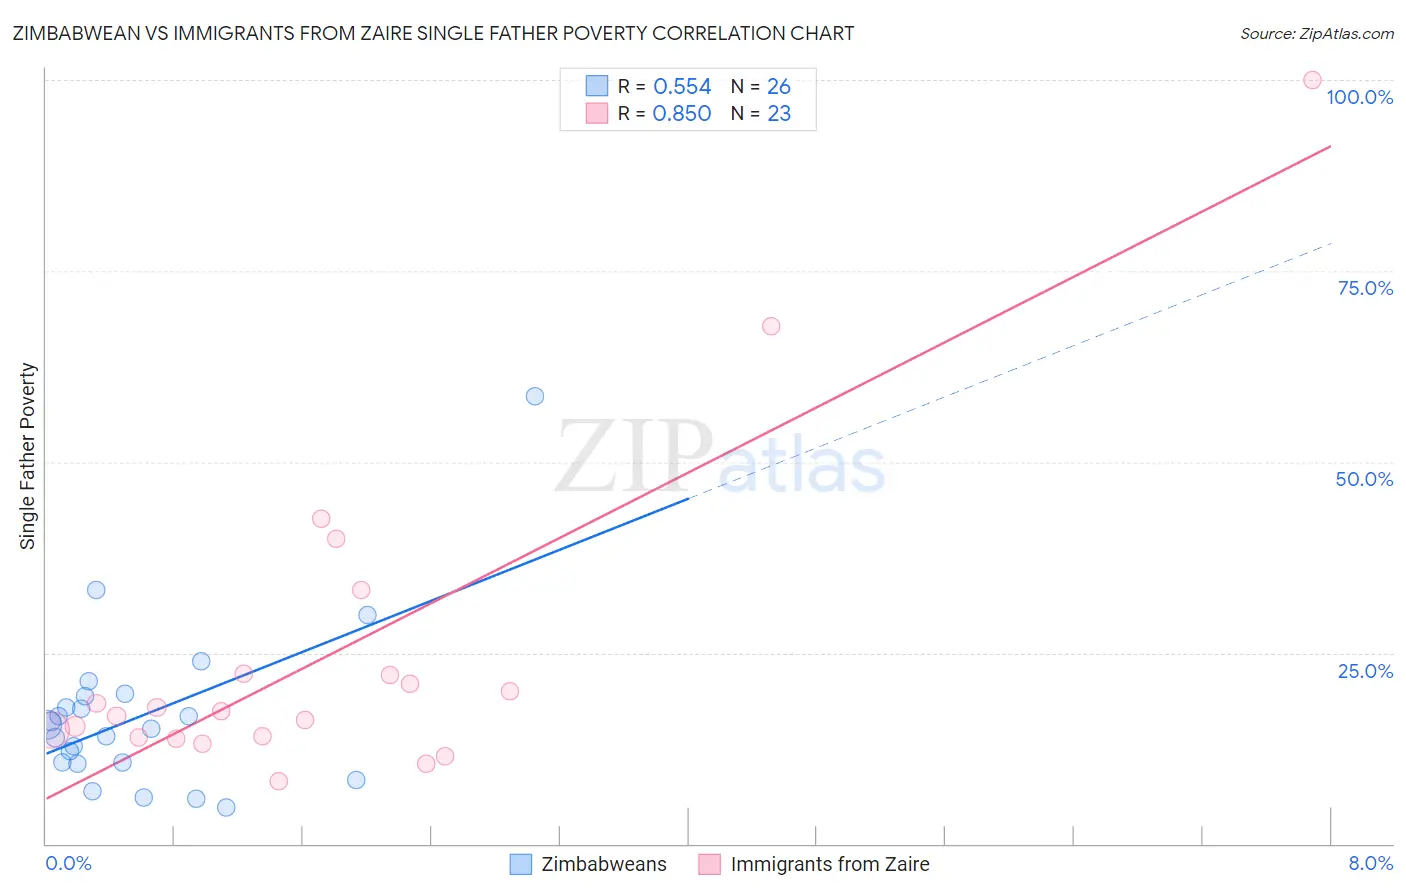
Zimbabwean vs Immigrants from Zaire Single Father Poverty Correlation Chart
The statistical analysis conducted on geographies consisting of 64,763,564 people shows a substantial positive correlation between the proportion of Zimbabweans and poverty level among single fathers in the United States with a correlation coefficient (R) of 0.554 and weighted average of 15.6%. Similarly, the statistical analysis conducted on geographies consisting of 97,955,340 people shows a very strong positive correlation between the proportion of Immigrants from Zaire and poverty level among single fathers in the United States with a correlation coefficient (R) of 0.850 and weighted average of 17.3%, a difference of 10.9%.
Single Father Poverty Correlation Summary
| Measurement | Zimbabwean | Immigrants from Zaire |
| Minimum | 4.8% | 8.2% |
| Maximum | 58.6% | 100.0% |
| Range | 53.8% | 91.8% |
| Mean | 16.8% | 24.8% |
| Median | 15.3% | 17.3% |
| Interquartile 25% (IQ1) | 10.6% | 14.0% |
| Interquartile 75% (IQ3) | 19.3% | 22.3% |
| Interquartile Range (IQR) | 8.7% | 8.3% |
| Standard Deviation (Sample) | 11.0% | 21.1% |
| Standard Deviation (Population) | 10.7% | 20.6% |
Similar Demographics by Single Father Poverty
Demographics Similar to Zimbabweans by Single Father Poverty
In terms of single father poverty, the demographic groups most similar to Zimbabweans are Yaqui (15.6%, a difference of 0.010%), Immigrants from Belgium (15.6%, a difference of 0.020%), Immigrants from Kazakhstan (15.6%, a difference of 0.030%), Immigrants from Uruguay (15.6%, a difference of 0.080%), and Basque (15.5%, a difference of 0.22%).
| Demographics | Rating | Rank | Single Father Poverty |
| Immigrants | Romania | 98.6 /100 | #91 | Exceptional 15.5% |
| Immigrants | Serbia | 98.5 /100 | #92 | Exceptional 15.5% |
| Basques | 98.4 /100 | #93 | Exceptional 15.5% |
| Immigrants | Uruguay | 98.2 /100 | #94 | Exceptional 15.6% |
| Immigrants | Kazakhstan | 98.2 /100 | #95 | Exceptional 15.6% |
| Immigrants | Belgium | 98.1 /100 | #96 | Exceptional 15.6% |
| Yaqui | 98.1 /100 | #97 | Exceptional 15.6% |
| Zimbabweans | 98.1 /100 | #98 | Exceptional 15.6% |
| Immigrants | Middle Africa | 97.4 /100 | #99 | Exceptional 15.6% |
| Immigrants | Chile | 96.9 /100 | #100 | Exceptional 15.7% |
| Fijians | 96.8 /100 | #101 | Exceptional 15.7% |
| Chileans | 96.4 /100 | #102 | Exceptional 15.7% |
| South American Indians | 96.2 /100 | #103 | Exceptional 15.7% |
| Australians | 96.1 /100 | #104 | Exceptional 15.7% |
| Immigrants | Australia | 96.1 /100 | #105 | Exceptional 15.7% |
Demographics Similar to Immigrants from Zaire by Single Father Poverty
In terms of single father poverty, the demographic groups most similar to Immigrants from Zaire are Lithuanian (17.3%, a difference of 0.010%), Swiss (17.3%, a difference of 0.13%), Slovene (17.3%, a difference of 0.22%), Polish (17.3%, a difference of 0.22%), and Jamaican (17.3%, a difference of 0.27%).
| Demographics | Rating | Rank | Single Father Poverty |
| Sierra Leoneans | 0.8 /100 | #255 | Tragic 17.2% |
| Immigrants | Haiti | 0.8 /100 | #256 | Tragic 17.2% |
| Immigrants | Albania | 0.7 /100 | #257 | Tragic 17.2% |
| Albanians | 0.7 /100 | #258 | Tragic 17.2% |
| Immigrants | Jamaica | 0.7 /100 | #259 | Tragic 17.2% |
| Spaniards | 0.6 /100 | #260 | Tragic 17.2% |
| Swiss | 0.5 /100 | #261 | Tragic 17.3% |
| Immigrants | Zaire | 0.4 /100 | #262 | Tragic 17.3% |
| Lithuanians | 0.4 /100 | #263 | Tragic 17.3% |
| Slovenes | 0.3 /100 | #264 | Tragic 17.3% |
| Poles | 0.3 /100 | #265 | Tragic 17.3% |
| Jamaicans | 0.3 /100 | #266 | Tragic 17.3% |
| Haitians | 0.3 /100 | #267 | Tragic 17.3% |
| Immigrants | Caribbean | 0.3 /100 | #268 | Tragic 17.4% |
| Slavs | 0.3 /100 | #269 | Tragic 17.4% |