U.S. Virgin Islander vs Inupiat Single Father Poverty
COMPARE
U.S. Virgin Islander
Inupiat
Single Father Poverty
Single Father Poverty Comparison
U.S. Virgin Islanders
Inupiat
18.1%
SINGLE FATHER POVERTY
0.0/ 100
METRIC RATING
294th/ 347
METRIC RANK
19.5%
SINGLE FATHER POVERTY
0.0/ 100
METRIC RATING
320th/ 347
METRIC RANK
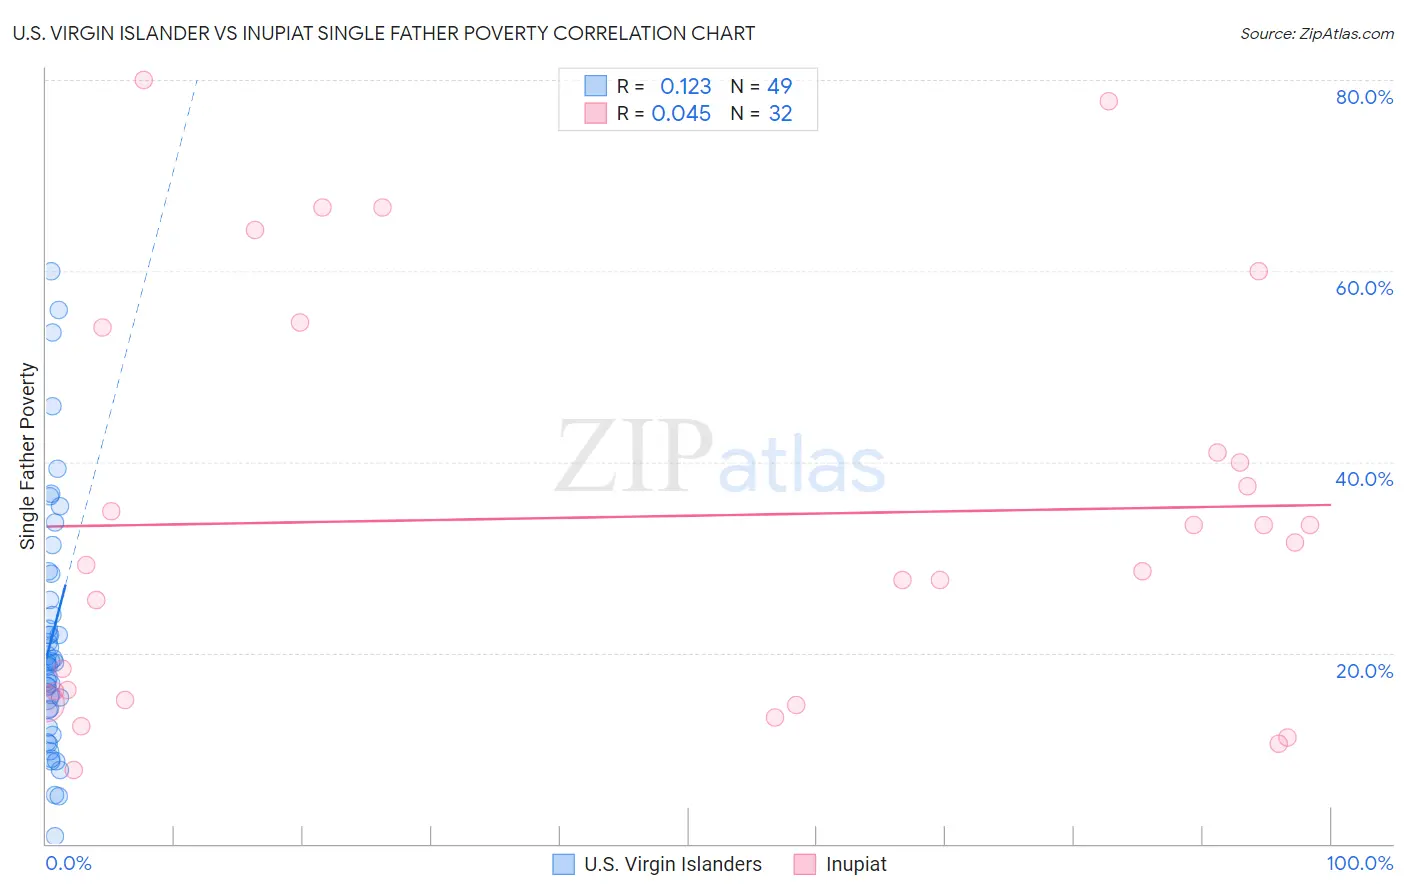
U.S. Virgin Islander vs Inupiat Single Father Poverty Correlation Chart
The statistical analysis conducted on geographies consisting of 82,675,302 people shows a poor positive correlation between the proportion of U.S. Virgin Islanders and poverty level among single fathers in the United States with a correlation coefficient (R) of 0.123 and weighted average of 18.1%. Similarly, the statistical analysis conducted on geographies consisting of 89,997,160 people shows no correlation between the proportion of Inupiat and poverty level among single fathers in the United States with a correlation coefficient (R) of 0.045 and weighted average of 19.5%, a difference of 7.5%.
Single Father Poverty Correlation Summary
| Measurement | U.S. Virgin Islander | Inupiat |
| Minimum | 0.75% | 7.7% |
| Maximum | 60.0% | 80.0% |
| Range | 59.2% | 72.3% |
| Mean | 21.5% | 34.3% |
| Median | 19.0% | 30.4% |
| Interquartile 25% (IQ1) | 13.1% | 15.5% |
| Interquartile 75% (IQ3) | 26.9% | 47.6% |
| Interquartile Range (IQR) | 13.8% | 32.1% |
| Standard Deviation (Sample) | 13.1% | 20.9% |
| Standard Deviation (Population) | 12.9% | 20.6% |
Similar Demographics by Single Father Poverty
Demographics Similar to U.S. Virgin Islanders by Single Father Poverty
In terms of single father poverty, the demographic groups most similar to U.S. Virgin Islanders are Alaska Native (18.1%, a difference of 0.030%), Yakama (18.1%, a difference of 0.060%), Immigrants from Bahamas (18.1%, a difference of 0.13%), Alaskan Athabascan (18.1%, a difference of 0.14%), and Seminole (18.1%, a difference of 0.17%).
| Demographics | Rating | Rank | Single Father Poverty |
| Carpatho Rusyns | 0.0 /100 | #287 | Tragic 18.0% |
| Bahamians | 0.0 /100 | #288 | Tragic 18.0% |
| Irish | 0.0 /100 | #289 | Tragic 18.0% |
| West Indians | 0.0 /100 | #290 | Tragic 18.0% |
| Alaskan Athabascans | 0.0 /100 | #291 | Tragic 18.1% |
| Immigrants | Bahamas | 0.0 /100 | #292 | Tragic 18.1% |
| Alaska Natives | 0.0 /100 | #293 | Tragic 18.1% |
| U.S. Virgin Islanders | 0.0 /100 | #294 | Tragic 18.1% |
| Yakama | 0.0 /100 | #295 | Tragic 18.1% |
| Seminole | 0.0 /100 | #296 | Tragic 18.1% |
| French | 0.0 /100 | #297 | Tragic 18.2% |
| Africans | 0.0 /100 | #298 | Tragic 18.3% |
| Whites/Caucasians | 0.0 /100 | #299 | Tragic 18.4% |
| Immigrants | Dominican Republic | 0.0 /100 | #300 | Tragic 18.4% |
| Hungarians | 0.0 /100 | #301 | Tragic 18.5% |
Demographics Similar to Inupiat by Single Father Poverty
In terms of single father poverty, the demographic groups most similar to Inupiat are Cherokee (19.6%, a difference of 0.85%), Slovak (19.3%, a difference of 0.91%), Dutch West Indian (19.2%, a difference of 1.4%), Creek (19.8%, a difference of 1.9%), and Dominican (19.1%, a difference of 2.0%).
| Demographics | Rating | Rank | Single Father Poverty |
| Potawatomi | 0.0 /100 | #313 | Tragic 18.9% |
| Delaware | 0.0 /100 | #314 | Tragic 18.9% |
| Chickasaw | 0.0 /100 | #315 | Tragic 19.0% |
| Osage | 0.0 /100 | #316 | Tragic 19.0% |
| Dominicans | 0.0 /100 | #317 | Tragic 19.1% |
| Dutch West Indians | 0.0 /100 | #318 | Tragic 19.2% |
| Slovaks | 0.0 /100 | #319 | Tragic 19.3% |
| Inupiat | 0.0 /100 | #320 | Tragic 19.5% |
| Cherokee | 0.0 /100 | #321 | Tragic 19.6% |
| Creek | 0.0 /100 | #322 | Tragic 19.8% |
| Pennsylvania Germans | 0.0 /100 | #323 | Tragic 20.0% |
| Americans | 0.0 /100 | #324 | Tragic 20.1% |
| Blacks/African Americans | 0.0 /100 | #325 | Tragic 20.4% |
| Immigrants | Yemen | 0.0 /100 | #326 | Tragic 20.6% |
| Choctaw | 0.0 /100 | #327 | Tragic 20.7% |