Zimbabwean vs Immigrants from Sri Lanka Single Father Poverty
COMPARE
Zimbabwean
Immigrants from Sri Lanka
Single Father Poverty
Single Father Poverty Comparison
Zimbabweans
Immigrants from Sri Lanka
15.6%
SINGLE FATHER POVERTY
98.1/ 100
METRIC RATING
98th/ 347
METRIC RANK
15.9%
SINGLE FATHER POVERTY
88.2/ 100
METRIC RATING
135th/ 347
METRIC RANK
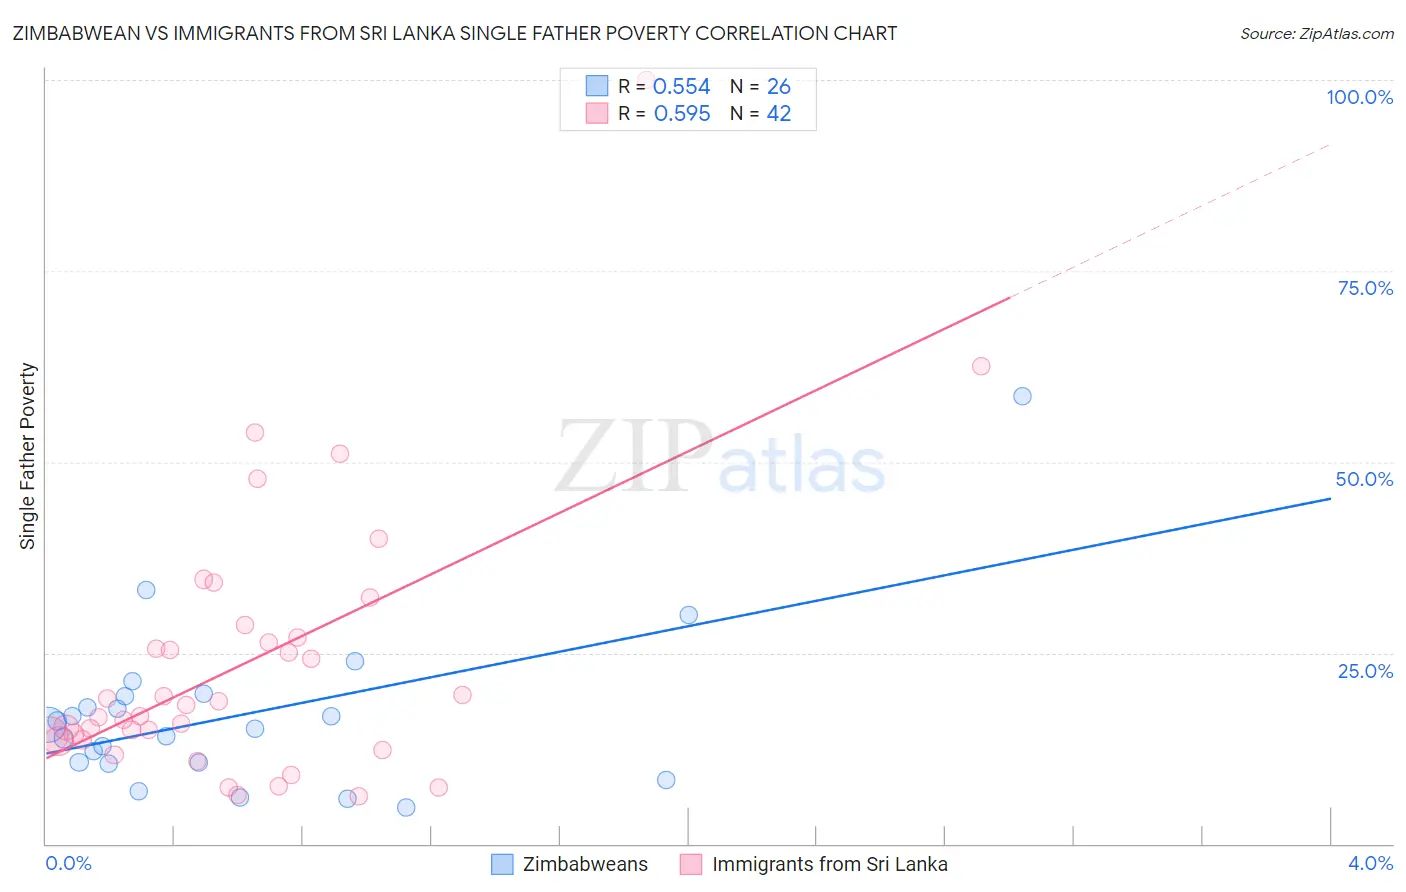
Zimbabwean vs Immigrants from Sri Lanka Single Father Poverty Correlation Chart
The statistical analysis conducted on geographies consisting of 64,763,564 people shows a substantial positive correlation between the proportion of Zimbabweans and poverty level among single fathers in the United States with a correlation coefficient (R) of 0.554 and weighted average of 15.6%. Similarly, the statistical analysis conducted on geographies consisting of 128,715,987 people shows a substantial positive correlation between the proportion of Immigrants from Sri Lanka and poverty level among single fathers in the United States with a correlation coefficient (R) of 0.595 and weighted average of 15.9%, a difference of 2.2%.
Single Father Poverty Correlation Summary
| Measurement | Zimbabwean | Immigrants from Sri Lanka |
| Minimum | 4.8% | 6.2% |
| Maximum | 58.6% | 100.0% |
| Range | 53.8% | 93.8% |
| Mean | 16.8% | 23.6% |
| Median | 15.3% | 17.4% |
| Interquartile 25% (IQ1) | 10.6% | 13.6% |
| Interquartile 75% (IQ3) | 19.3% | 27.0% |
| Interquartile Range (IQR) | 8.7% | 13.5% |
| Standard Deviation (Sample) | 11.0% | 18.0% |
| Standard Deviation (Population) | 10.7% | 17.8% |
Similar Demographics by Single Father Poverty
Demographics Similar to Zimbabweans by Single Father Poverty
In terms of single father poverty, the demographic groups most similar to Zimbabweans are Yaqui (15.6%, a difference of 0.010%), Immigrants from Belgium (15.6%, a difference of 0.020%), Immigrants from Kazakhstan (15.6%, a difference of 0.030%), Immigrants from Uruguay (15.6%, a difference of 0.080%), and Basque (15.5%, a difference of 0.22%).
| Demographics | Rating | Rank | Single Father Poverty |
| Immigrants | Romania | 98.6 /100 | #91 | Exceptional 15.5% |
| Immigrants | Serbia | 98.5 /100 | #92 | Exceptional 15.5% |
| Basques | 98.4 /100 | #93 | Exceptional 15.5% |
| Immigrants | Uruguay | 98.2 /100 | #94 | Exceptional 15.6% |
| Immigrants | Kazakhstan | 98.2 /100 | #95 | Exceptional 15.6% |
| Immigrants | Belgium | 98.1 /100 | #96 | Exceptional 15.6% |
| Yaqui | 98.1 /100 | #97 | Exceptional 15.6% |
| Zimbabweans | 98.1 /100 | #98 | Exceptional 15.6% |
| Immigrants | Middle Africa | 97.4 /100 | #99 | Exceptional 15.6% |
| Immigrants | Chile | 96.9 /100 | #100 | Exceptional 15.7% |
| Fijians | 96.8 /100 | #101 | Exceptional 15.7% |
| Chileans | 96.4 /100 | #102 | Exceptional 15.7% |
| South American Indians | 96.2 /100 | #103 | Exceptional 15.7% |
| Australians | 96.1 /100 | #104 | Exceptional 15.7% |
| Immigrants | Australia | 96.1 /100 | #105 | Exceptional 15.7% |
Demographics Similar to Immigrants from Sri Lanka by Single Father Poverty
In terms of single father poverty, the demographic groups most similar to Immigrants from Sri Lanka are Immigrants from South America (15.9%, a difference of 0.030%), Cypriot (15.9%, a difference of 0.070%), Immigrants from the Azores (15.9%, a difference of 0.11%), Central American (16.0%, a difference of 0.11%), and Immigrants from Syria (15.9%, a difference of 0.15%).
| Demographics | Rating | Rank | Single Father Poverty |
| Immigrants | Nigeria | 90.8 /100 | #128 | Exceptional 15.9% |
| Immigrants | West Indies | 90.8 /100 | #129 | Exceptional 15.9% |
| Norwegians | 90.2 /100 | #130 | Exceptional 15.9% |
| Nicaraguans | 90.1 /100 | #131 | Exceptional 15.9% |
| Immigrants | Portugal | 89.7 /100 | #132 | Excellent 15.9% |
| Immigrants | Syria | 89.5 /100 | #133 | Excellent 15.9% |
| Immigrants | South America | 88.5 /100 | #134 | Excellent 15.9% |
| Immigrants | Sri Lanka | 88.2 /100 | #135 | Excellent 15.9% |
| Cypriots | 87.5 /100 | #136 | Excellent 15.9% |
| Immigrants | Azores | 87.2 /100 | #137 | Excellent 15.9% |
| Central Americans | 87.1 /100 | #138 | Excellent 16.0% |
| South Americans | 85.9 /100 | #139 | Excellent 16.0% |
| Immigrants | Netherlands | 85.3 /100 | #140 | Excellent 16.0% |
| Liberians | 83.3 /100 | #141 | Excellent 16.0% |
| Immigrants | Mexico | 83.3 /100 | #142 | Excellent 16.0% |