Tohono O'odham vs Lumbee 9th Grade
COMPARE
Tohono O'odham
Lumbee
9th Grade
9th Grade Comparison
Tohono O'odham
Lumbee
92.6%
9TH GRADE
0.0/ 100
METRIC RATING
304th/ 347
METRIC RANK
94.4%
9TH GRADE
4.7/ 100
METRIC RATING
228th/ 347
METRIC RANK
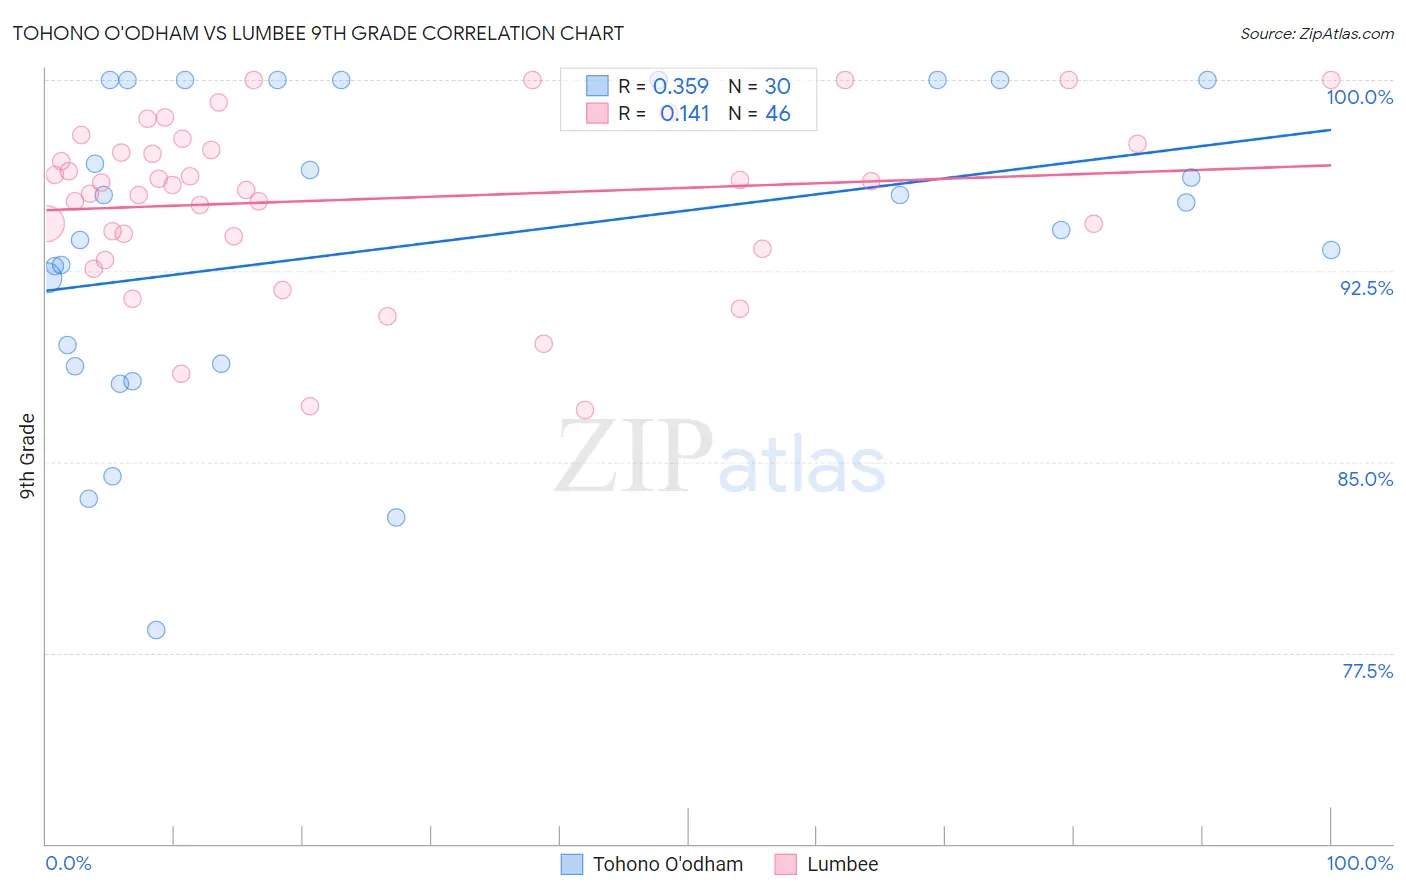
Tohono O'odham vs Lumbee 9th Grade Correlation Chart
The statistical analysis conducted on geographies consisting of 58,730,411 people shows a mild positive correlation between the proportion of Tohono O'odham and percentage of population with at least 9th grade education in the United States with a correlation coefficient (R) of 0.359 and weighted average of 92.6%. Similarly, the statistical analysis conducted on geographies consisting of 92,298,865 people shows a poor positive correlation between the proportion of Lumbee and percentage of population with at least 9th grade education in the United States with a correlation coefficient (R) of 0.141 and weighted average of 94.4%, a difference of 1.8%.
9th Grade Correlation Summary
| Measurement | Tohono O'odham | Lumbee |
| Minimum | 78.4% | 87.0% |
| Maximum | 100.0% | 100.0% |
| Range | 21.6% | 13.0% |
| Mean | 93.6% | 95.3% |
| Median | 94.7% | 95.9% |
| Interquartile 25% (IQ1) | 88.8% | 93.9% |
| Interquartile 75% (IQ3) | 100.0% | 97.5% |
| Interquartile Range (IQR) | 11.2% | 3.6% |
| Standard Deviation (Sample) | 6.1% | 3.3% |
| Standard Deviation (Population) | 5.9% | 3.3% |
Similar Demographics by 9th Grade
Demographics Similar to Tohono O'odham by 9th Grade
In terms of 9th grade, the demographic groups most similar to Tohono O'odham are Guyanese (92.7%, a difference of 0.020%), Japanese (92.6%, a difference of 0.020%), Immigrants from Vietnam (92.6%, a difference of 0.020%), Immigrants from Dominica (92.7%, a difference of 0.040%), and Immigrants from Haiti (92.7%, a difference of 0.12%).
| Demographics | Rating | Rank | 9th Grade |
| Fijians | 0.0 /100 | #297 | Tragic 93.1% |
| Haitians | 0.0 /100 | #298 | Tragic 93.1% |
| Immigrants | Grenada | 0.0 /100 | #299 | Tragic 93.0% |
| Yaqui | 0.0 /100 | #300 | Tragic 92.9% |
| Immigrants | Haiti | 0.0 /100 | #301 | Tragic 92.7% |
| Immigrants | Dominica | 0.0 /100 | #302 | Tragic 92.7% |
| Guyanese | 0.0 /100 | #303 | Tragic 92.7% |
| Tohono O'odham | 0.0 /100 | #304 | Tragic 92.6% |
| Japanese | 0.0 /100 | #305 | Tragic 92.6% |
| Immigrants | Vietnam | 0.0 /100 | #306 | Tragic 92.6% |
| Immigrants | Immigrants | 0.0 /100 | #307 | Tragic 92.5% |
| Immigrants | Guyana | 0.0 /100 | #308 | Tragic 92.5% |
| Immigrants | Bangladesh | 0.0 /100 | #309 | Tragic 92.4% |
| Immigrants | Cambodia | 0.0 /100 | #310 | Tragic 92.4% |
| Immigrants | Fiji | 0.0 /100 | #311 | Tragic 92.3% |
Demographics Similar to Lumbee by 9th Grade
In terms of 9th grade, the demographic groups most similar to Lumbee are Immigrants from Sierra Leone (94.4%, a difference of 0.0%), Immigrants from Southern Europe (94.3%, a difference of 0.010%), Apache (94.3%, a difference of 0.020%), Ethiopian (94.4%, a difference of 0.030%), and Subsaharan African (94.4%, a difference of 0.030%).
| Demographics | Rating | Rank | 9th Grade |
| Immigrants | Eastern Africa | 8.2 /100 | #221 | Tragic 94.5% |
| Immigrants | Asia | 7.7 /100 | #222 | Tragic 94.4% |
| Bahamians | 7.0 /100 | #223 | Tragic 94.4% |
| Tongans | 6.0 /100 | #224 | Tragic 94.4% |
| Ethiopians | 5.4 /100 | #225 | Tragic 94.4% |
| Sub-Saharan Africans | 5.4 /100 | #226 | Tragic 94.4% |
| Immigrants | Sierra Leone | 4.8 /100 | #227 | Tragic 94.4% |
| Lumbee | 4.7 /100 | #228 | Tragic 94.4% |
| Immigrants | Southern Europe | 4.5 /100 | #229 | Tragic 94.3% |
| Apache | 4.2 /100 | #230 | Tragic 94.3% |
| Immigrants | Panama | 4.0 /100 | #231 | Tragic 94.3% |
| Immigrants | Africa | 3.9 /100 | #232 | Tragic 94.3% |
| Nigerians | 3.7 /100 | #233 | Tragic 94.3% |
| Costa Ricans | 3.5 /100 | #234 | Tragic 94.3% |
| Bolivians | 3.3 /100 | #235 | Tragic 94.3% |