Tohono O'odham vs Hmong Married-Couple Family Poverty
COMPARE
Tohono O'odham
Hmong
Married-Couple Family Poverty
Married-Couple Family Poverty Comparison
Tohono O'odham
Hmong
11.2%
MARRIED-COUPLE FAMILY POVERTY
0.0/ 100
METRIC RATING
342nd/ 347
METRIC RANK
5.0%
MARRIED-COUPLE FAMILY POVERTY
83.2/ 100
METRIC RATING
144th/ 347
METRIC RANK
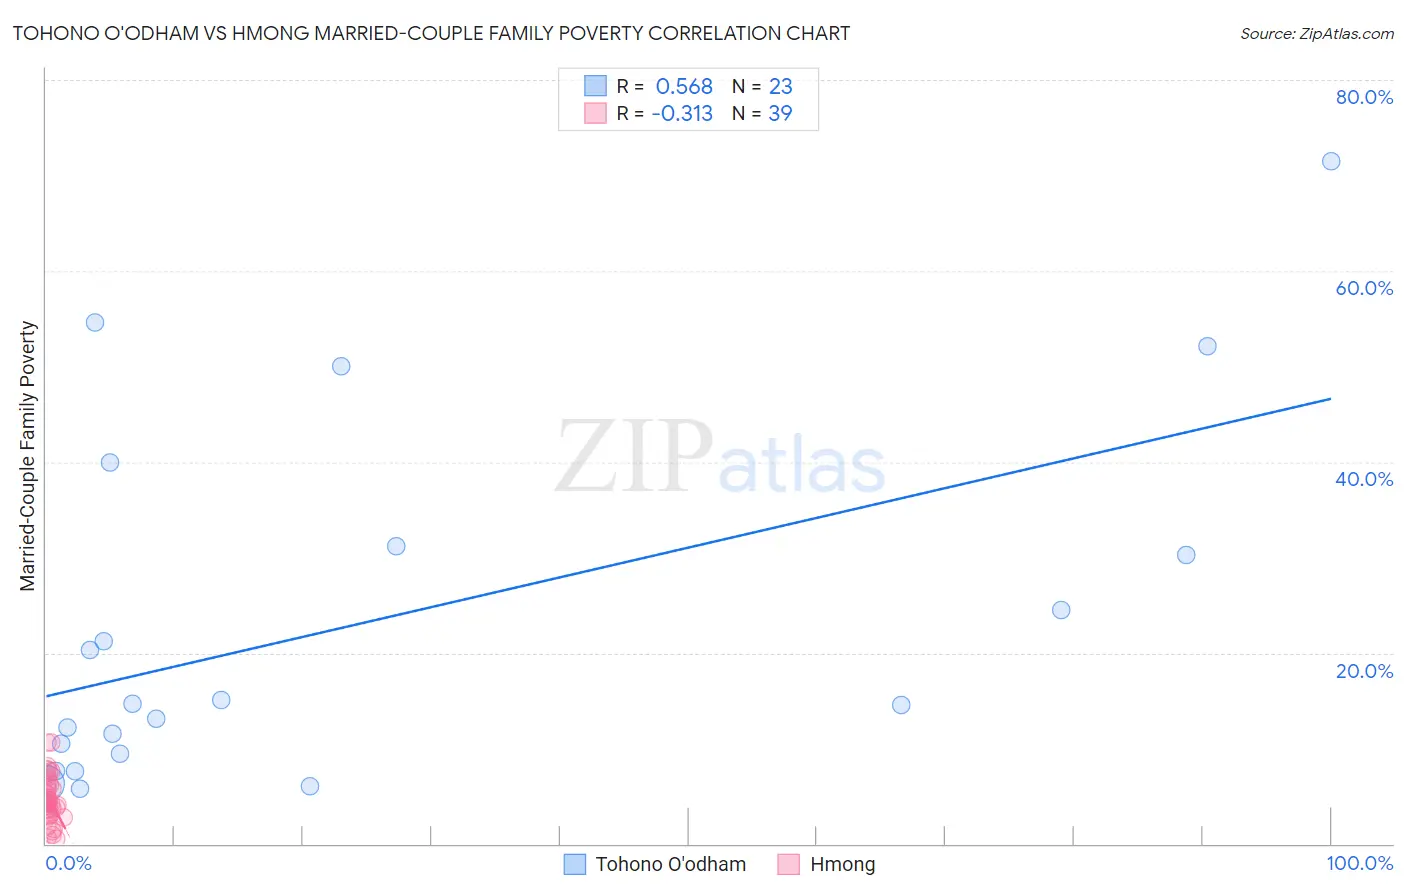
Tohono O'odham vs Hmong Married-Couple Family Poverty Correlation Chart
The statistical analysis conducted on geographies consisting of 58,693,710 people shows a substantial positive correlation between the proportion of Tohono O'odham and poverty level among married-couple families in the United States with a correlation coefficient (R) of 0.568 and weighted average of 11.2%. Similarly, the statistical analysis conducted on geographies consisting of 24,678,157 people shows a mild negative correlation between the proportion of Hmong and poverty level among married-couple families in the United States with a correlation coefficient (R) of -0.313 and weighted average of 5.0%, a difference of 125.5%.
Married-Couple Family Poverty Correlation Summary
| Measurement | Tohono O'odham | Hmong |
| Minimum | 5.8% | 0.50% |
| Maximum | 71.6% | 10.7% |
| Range | 65.8% | 10.2% |
| Mean | 23.0% | 4.7% |
| Median | 14.7% | 4.3% |
| Interquartile 25% (IQ1) | 9.4% | 3.1% |
| Interquartile 75% (IQ3) | 31.2% | 6.1% |
| Interquartile Range (IQR) | 21.8% | 3.0% |
| Standard Deviation (Sample) | 18.6% | 2.4% |
| Standard Deviation (Population) | 18.2% | 2.4% |
Similar Demographics by Married-Couple Family Poverty
Demographics Similar to Tohono O'odham by Married-Couple Family Poverty
In terms of married-couple family poverty, the demographic groups most similar to Tohono O'odham are Pueblo (11.1%, a difference of 0.93%), Pima (11.4%, a difference of 1.7%), Navajo (11.9%, a difference of 5.6%), Puerto Rican (12.6%, a difference of 12.6%), and Immigrants from Yemen (12.8%, a difference of 14.1%).
| Demographics | Rating | Rank | Married-Couple Family Poverty |
| Lumbee | 0.0 /100 | #333 | Tragic 8.3% |
| Immigrants | Dominican Republic | 0.0 /100 | #334 | Tragic 8.4% |
| Sioux | 0.0 /100 | #335 | Tragic 8.7% |
| Apache | 0.0 /100 | #336 | Tragic 9.0% |
| Yakama | 0.0 /100 | #337 | Tragic 9.0% |
| Cheyenne | 0.0 /100 | #338 | Tragic 9.4% |
| Crow | 0.0 /100 | #339 | Tragic 9.6% |
| Yuman | 0.0 /100 | #340 | Tragic 9.7% |
| Pueblo | 0.0 /100 | #341 | Tragic 11.1% |
| Tohono O'odham | 0.0 /100 | #342 | Tragic 11.2% |
| Pima | 0.0 /100 | #343 | Tragic 11.4% |
| Navajo | 0.0 /100 | #344 | Tragic 11.9% |
| Puerto Ricans | 0.0 /100 | #345 | Tragic 12.6% |
| Immigrants | Yemen | 0.0 /100 | #346 | Tragic 12.8% |
| Yup'ik | 0.0 /100 | #347 | Tragic 13.4% |
Demographics Similar to Hmong by Married-Couple Family Poverty
In terms of married-couple family poverty, the demographic groups most similar to Hmong are Immigrants from Egypt (5.0%, a difference of 0.050%), Immigrants from Brazil (5.0%, a difference of 0.32%), Immigrants from China (5.0%, a difference of 0.32%), Immigrants from Portugal (5.0%, a difference of 0.37%), and German Russian (5.0%, a difference of 0.43%).
| Demographics | Rating | Rank | Married-Couple Family Poverty |
| Guamanians/Chamorros | 86.5 /100 | #137 | Excellent 4.9% |
| Chileans | 86.0 /100 | #138 | Excellent 4.9% |
| German Russians | 85.1 /100 | #139 | Excellent 5.0% |
| Immigrants | Portugal | 84.8 /100 | #140 | Excellent 5.0% |
| Immigrants | Brazil | 84.6 /100 | #141 | Excellent 5.0% |
| Immigrants | China | 84.6 /100 | #142 | Excellent 5.0% |
| Immigrants | Egypt | 83.4 /100 | #143 | Excellent 5.0% |
| Hmong | 83.2 /100 | #144 | Excellent 5.0% |
| Immigrants | Spain | 79.9 /100 | #145 | Good 5.0% |
| Mongolians | 79.8 /100 | #146 | Good 5.0% |
| Syrians | 78.7 /100 | #147 | Good 5.0% |
| Immigrants | Russia | 78.7 /100 | #148 | Good 5.0% |
| Immigrants | Oceania | 78.6 /100 | #149 | Good 5.0% |
| Brazilians | 78.3 /100 | #150 | Good 5.0% |
| Immigrants | Cameroon | 77.3 /100 | #151 | Good 5.0% |