Spanish American Indian vs Finnish Married-Couple Family Poverty
COMPARE
Spanish American Indian
Finnish
Married-Couple Family Poverty
Married-Couple Family Poverty Comparison
Spanish American Indians
Finns
7.1%
MARRIED-COUPLE FAMILY POVERTY
0.0/ 100
METRIC RATING
308th/ 347
METRIC RANK
4.2%
MARRIED-COUPLE FAMILY POVERTY
99.9/ 100
METRIC RATING
30th/ 347
METRIC RANK
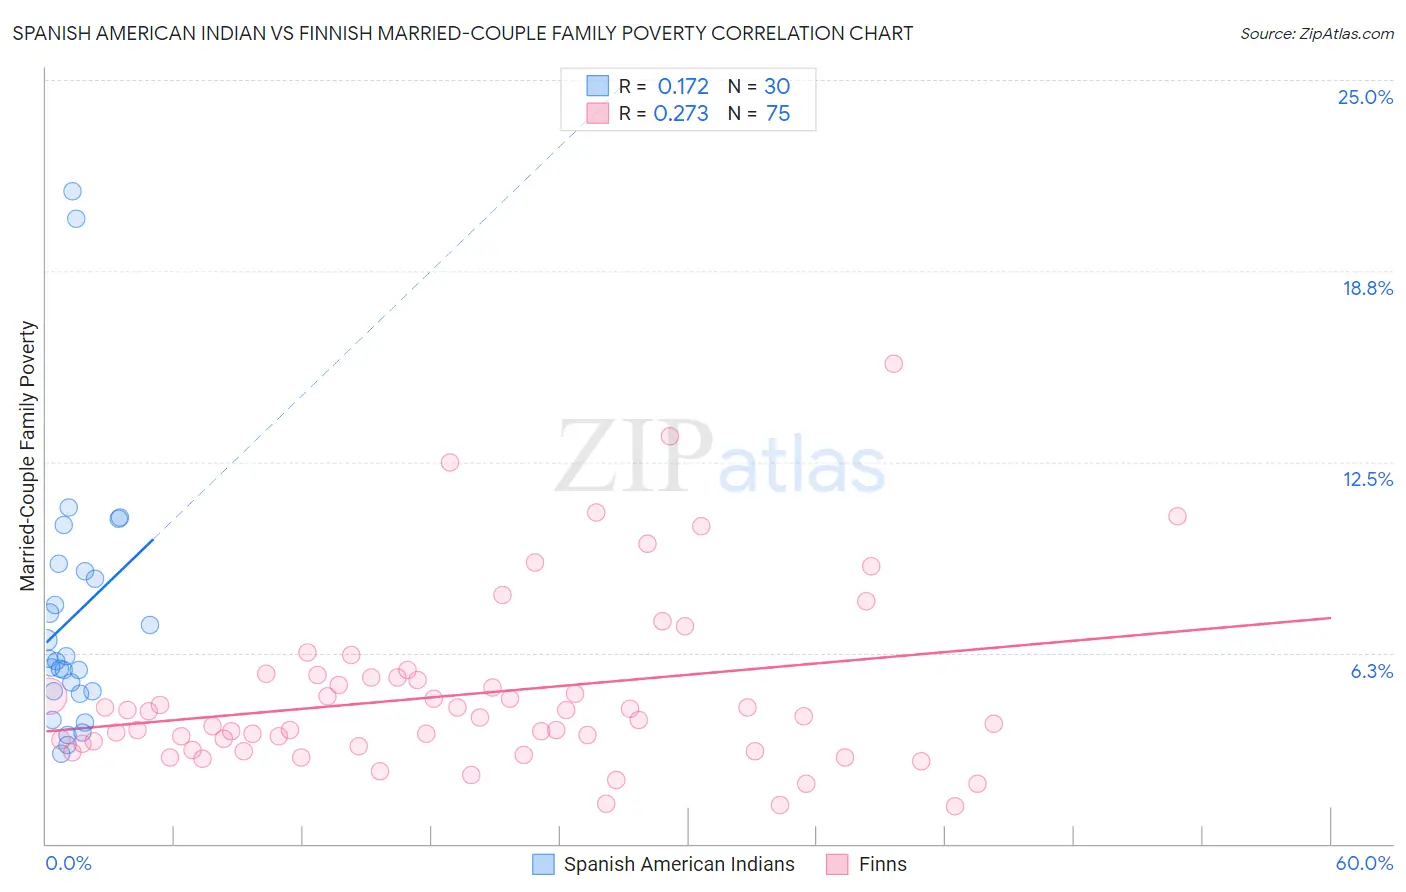
Spanish American Indian vs Finnish Married-Couple Family Poverty Correlation Chart
The statistical analysis conducted on geographies consisting of 73,069,372 people shows a poor positive correlation between the proportion of Spanish American Indians and poverty level among married-couple families in the United States with a correlation coefficient (R) of 0.172 and weighted average of 7.1%. Similarly, the statistical analysis conducted on geographies consisting of 399,709,206 people shows a weak positive correlation between the proportion of Finns and poverty level among married-couple families in the United States with a correlation coefficient (R) of 0.273 and weighted average of 4.2%, a difference of 69.4%.
Married-Couple Family Poverty Correlation Summary
| Measurement | Spanish American Indian | Finnish |
| Minimum | 3.0% | 1.2% |
| Maximum | 21.3% | 15.7% |
| Range | 18.4% | 14.5% |
| Mean | 7.4% | 4.9% |
| Median | 6.0% | 4.1% |
| Interquartile 25% (IQ1) | 5.0% | 3.2% |
| Interquartile 75% (IQ3) | 8.9% | 5.5% |
| Interquartile Range (IQR) | 3.9% | 2.3% |
| Standard Deviation (Sample) | 4.3% | 2.8% |
| Standard Deviation (Population) | 4.3% | 2.8% |
Similar Demographics by Married-Couple Family Poverty
Demographics Similar to Spanish American Indians by Married-Couple Family Poverty
In terms of married-couple family poverty, the demographic groups most similar to Spanish American Indians are Guatemalan (7.0%, a difference of 0.18%), Hopi (7.1%, a difference of 0.60%), Immigrants from Nicaragua (7.1%, a difference of 0.62%), Immigrants from Dominica (7.1%, a difference of 0.68%), and Immigrants from Armenia (7.1%, a difference of 0.68%).
| Demographics | Rating | Rank | Married-Couple Family Poverty |
| Central Americans | 0.0 /100 | #301 | Tragic 6.7% |
| Immigrants | Ecuador | 0.0 /100 | #302 | Tragic 6.7% |
| Immigrants | El Salvador | 0.0 /100 | #303 | Tragic 6.8% |
| Cubans | 0.0 /100 | #304 | Tragic 6.8% |
| Haitians | 0.0 /100 | #305 | Tragic 6.8% |
| Immigrants | Haiti | 0.0 /100 | #306 | Tragic 7.0% |
| Guatemalans | 0.0 /100 | #307 | Tragic 7.0% |
| Spanish American Indians | 0.0 /100 | #308 | Tragic 7.1% |
| Hopi | 0.0 /100 | #309 | Tragic 7.1% |
| Immigrants | Nicaragua | 0.0 /100 | #310 | Tragic 7.1% |
| Immigrants | Dominica | 0.0 /100 | #311 | Tragic 7.1% |
| Immigrants | Armenia | 0.0 /100 | #312 | Tragic 7.1% |
| Immigrants | St. Vincent and the Grenadines | 0.0 /100 | #313 | Tragic 7.1% |
| British West Indians | 0.0 /100 | #314 | Tragic 7.1% |
| Inupiat | 0.0 /100 | #315 | Tragic 7.1% |
Demographics Similar to Finns by Married-Couple Family Poverty
In terms of married-couple family poverty, the demographic groups most similar to Finns are Estonian (4.2%, a difference of 0.080%), Greek (4.2%, a difference of 0.19%), Immigrants from Scotland (4.2%, a difference of 0.24%), Scandinavian (4.1%, a difference of 0.28%), and Danish (4.1%, a difference of 0.39%).
| Demographics | Rating | Rank | Married-Couple Family Poverty |
| Bhutanese | 99.9 /100 | #23 | Exceptional 4.1% |
| Eastern Europeans | 99.9 /100 | #24 | Exceptional 4.1% |
| Immigrants | Taiwan | 99.9 /100 | #25 | Exceptional 4.1% |
| Cypriots | 99.9 /100 | #26 | Exceptional 4.1% |
| Danes | 99.9 /100 | #27 | Exceptional 4.1% |
| Scandinavians | 99.9 /100 | #28 | Exceptional 4.1% |
| Immigrants | Scotland | 99.9 /100 | #29 | Exceptional 4.2% |
| Finns | 99.9 /100 | #30 | Exceptional 4.2% |
| Estonians | 99.9 /100 | #31 | Exceptional 4.2% |
| Greeks | 99.9 /100 | #32 | Exceptional 4.2% |
| Irish | 99.9 /100 | #33 | Exceptional 4.2% |
| Dutch | 99.9 /100 | #34 | Exceptional 4.2% |
| Europeans | 99.9 /100 | #35 | Exceptional 4.2% |
| English | 99.9 /100 | #36 | Exceptional 4.2% |
| Iranians | 99.9 /100 | #37 | Exceptional 4.2% |