Spanish American Indian vs Finnish Median Household Income
COMPARE
Spanish American Indian
Finnish
Median Household Income
Median Household Income Comparison
Spanish American Indians
Finns
$76,670
MEDIAN HOUSEHOLD INCOME
0.4/ 100
METRIC RATING
259th/ 347
METRIC RANK
$83,607
MEDIAN HOUSEHOLD INCOME
27.7/ 100
METRIC RATING
193rd/ 347
METRIC RANK
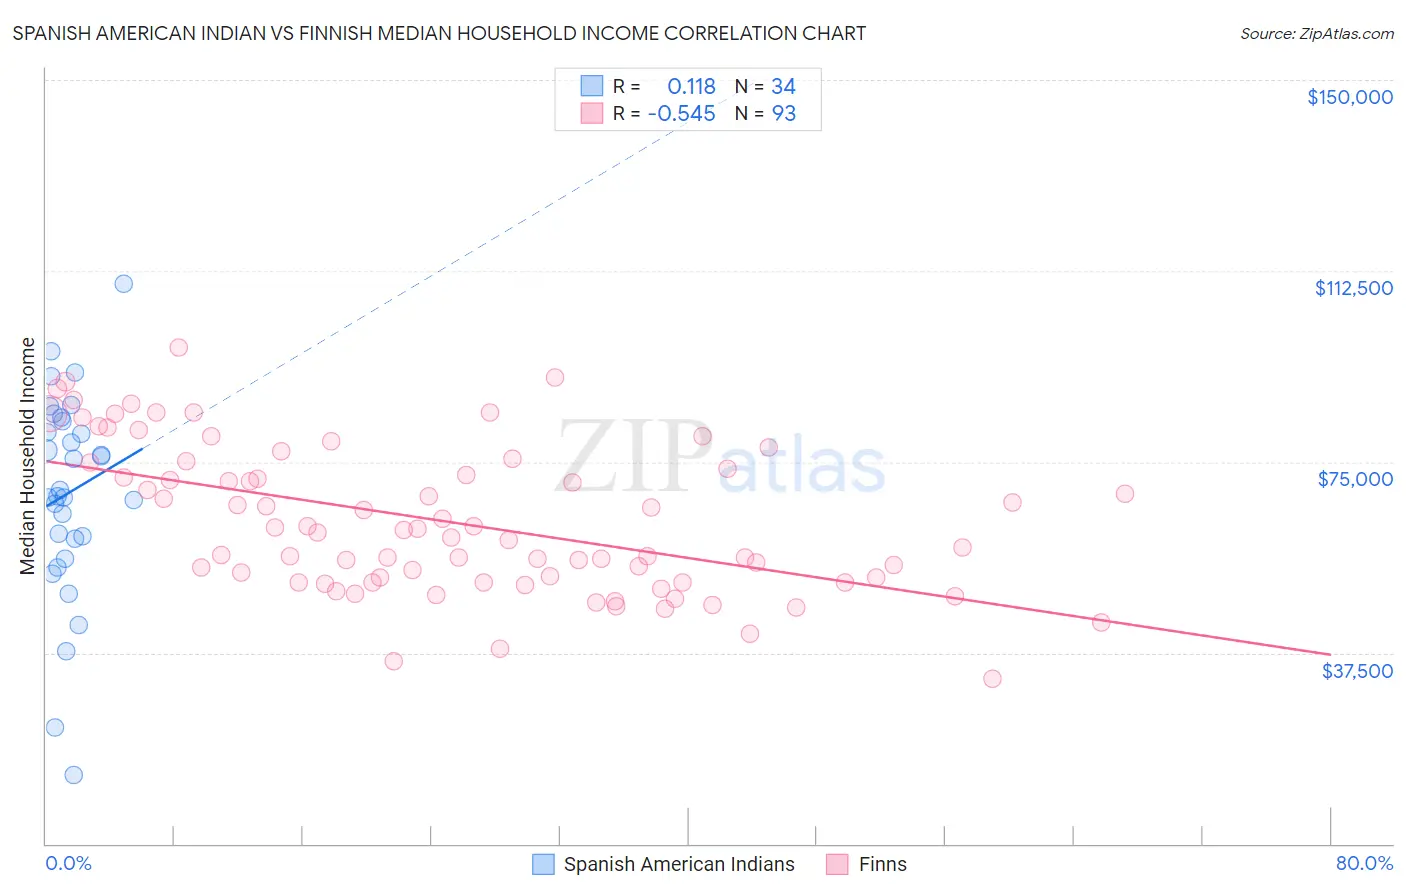
Spanish American Indian vs Finnish Median Household Income Correlation Chart
The statistical analysis conducted on geographies consisting of 73,142,507 people shows a poor positive correlation between the proportion of Spanish American Indians and median household income in the United States with a correlation coefficient (R) of 0.118 and weighted average of $76,670. Similarly, the statistical analysis conducted on geographies consisting of 404,464,617 people shows a substantial negative correlation between the proportion of Finns and median household income in the United States with a correlation coefficient (R) of -0.545 and weighted average of $83,607, a difference of 9.0%.
Median Household Income Correlation Summary
| Measurement | Spanish American Indian | Finnish |
| Minimum | $13,474 | $32,321 |
| Maximum | $110,000 | $97,373 |
| Range | $96,526 | $65,052 |
| Mean | $68,921 | $63,204 |
| Median | $68,901 | $61,019 |
| Interquartile 25% (IQ1) | $59,929 | $51,350 |
| Interquartile 75% (IQ3) | $82,889 | $74,285 |
| Interquartile Range (IQR) | $22,960 | $22,935 |
| Standard Deviation (Sample) | $20,226 | $14,392 |
| Standard Deviation (Population) | $19,926 | $14,315 |
Similar Demographics by Median Household Income
Demographics Similar to Spanish American Indians by Median Household Income
In terms of median household income, the demographic groups most similar to Spanish American Indians are Jamaican ($76,583, a difference of 0.11%), Immigrants from Nicaragua ($76,784, a difference of 0.15%), Immigrants from Grenada ($76,517, a difference of 0.20%), Immigrants from Senegal ($76,915, a difference of 0.32%), and French American Indian ($76,387, a difference of 0.37%).
| Demographics | Rating | Rank | Median Household Income |
| Immigrants | West Indies | 1.0 /100 | #252 | Tragic $77,956 |
| Immigrants | St. Vincent and the Grenadines | 0.9 /100 | #253 | Tragic $77,690 |
| Sub-Saharan Africans | 0.8 /100 | #254 | Tragic $77,631 |
| Immigrants | Middle Africa | 0.8 /100 | #255 | Tragic $77,559 |
| Belizeans | 0.6 /100 | #256 | Tragic $77,028 |
| Immigrants | Senegal | 0.5 /100 | #257 | Tragic $76,915 |
| Immigrants | Nicaragua | 0.5 /100 | #258 | Tragic $76,784 |
| Spanish American Indians | 0.4 /100 | #259 | Tragic $76,670 |
| Jamaicans | 0.4 /100 | #260 | Tragic $76,583 |
| Immigrants | Grenada | 0.4 /100 | #261 | Tragic $76,517 |
| French American Indians | 0.4 /100 | #262 | Tragic $76,387 |
| Alaskan Athabascans | 0.4 /100 | #263 | Tragic $76,383 |
| Guatemalans | 0.3 /100 | #264 | Tragic $75,961 |
| Immigrants | Belize | 0.3 /100 | #265 | Tragic $75,938 |
| Americans | 0.3 /100 | #266 | Tragic $75,932 |
Demographics Similar to Finns by Median Household Income
In terms of median household income, the demographic groups most similar to Finns are Welsh ($83,628, a difference of 0.030%), Ghanaian ($83,582, a difference of 0.030%), Immigrants from Armenia ($83,555, a difference of 0.060%), French ($83,468, a difference of 0.17%), and Iraqi ($83,753, a difference of 0.18%).
| Demographics | Rating | Rank | Median Household Income |
| Puget Sound Salish | 33.2 /100 | #186 | Fair $84,011 |
| Belgians | 33.2 /100 | #187 | Fair $84,008 |
| Tlingit-Haida | 32.6 /100 | #188 | Fair $83,968 |
| Immigrants | Colombia | 31.7 /100 | #189 | Fair $83,902 |
| Slovaks | 30.2 /100 | #190 | Fair $83,798 |
| Iraqis | 29.6 /100 | #191 | Fair $83,753 |
| Welsh | 28.0 /100 | #192 | Fair $83,628 |
| Finns | 27.7 /100 | #193 | Fair $83,607 |
| Ghanaians | 27.4 /100 | #194 | Fair $83,582 |
| Immigrants | Armenia | 27.0 /100 | #195 | Fair $83,555 |
| French | 26.0 /100 | #196 | Fair $83,468 |
| Aleuts | 25.7 /100 | #197 | Fair $83,446 |
| Japanese | 25.1 /100 | #198 | Fair $83,395 |
| Germans | 24.6 /100 | #199 | Fair $83,358 |
| Tsimshian | 24.5 /100 | #200 | Fair $83,346 |