Spanish American Indian vs Immigrants from Eastern Africa Married-Couple Family Poverty
COMPARE
Spanish American Indian
Immigrants from Eastern Africa
Married-Couple Family Poverty
Married-Couple Family Poverty Comparison
Spanish American Indians
Immigrants from Eastern Africa
7.1%
MARRIED-COUPLE FAMILY POVERTY
0.0/ 100
METRIC RATING
308th/ 347
METRIC RANK
5.2%
MARRIED-COUPLE FAMILY POVERTY
50.0/ 100
METRIC RATING
174th/ 347
METRIC RANK
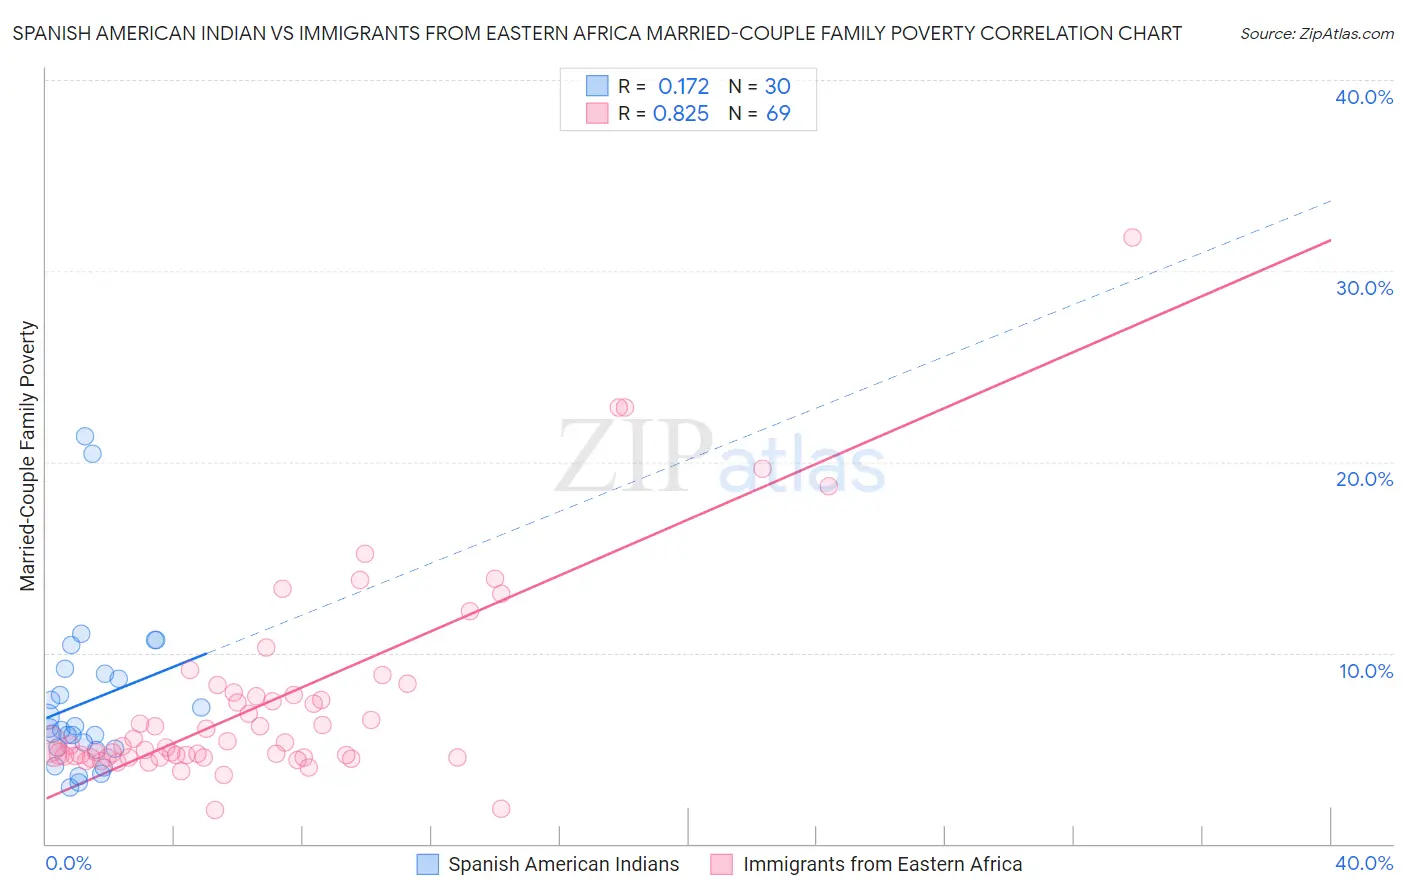
Spanish American Indian vs Immigrants from Eastern Africa Married-Couple Family Poverty Correlation Chart
The statistical analysis conducted on geographies consisting of 73,069,372 people shows a poor positive correlation between the proportion of Spanish American Indians and poverty level among married-couple families in the United States with a correlation coefficient (R) of 0.172 and weighted average of 7.1%. Similarly, the statistical analysis conducted on geographies consisting of 352,572,169 people shows a very strong positive correlation between the proportion of Immigrants from Eastern Africa and poverty level among married-couple families in the United States with a correlation coefficient (R) of 0.825 and weighted average of 5.2%, a difference of 35.1%.
Married-Couple Family Poverty Correlation Summary
| Measurement | Spanish American Indian | Immigrants from Eastern Africa |
| Minimum | 3.0% | 1.7% |
| Maximum | 21.3% | 31.7% |
| Range | 18.4% | 30.0% |
| Mean | 7.4% | 7.5% |
| Median | 6.0% | 5.2% |
| Interquartile 25% (IQ1) | 5.0% | 4.5% |
| Interquartile 75% (IQ3) | 8.9% | 7.8% |
| Interquartile Range (IQR) | 3.9% | 3.3% |
| Standard Deviation (Sample) | 4.3% | 5.4% |
| Standard Deviation (Population) | 4.3% | 5.3% |
Similar Demographics by Married-Couple Family Poverty
Demographics Similar to Spanish American Indians by Married-Couple Family Poverty
In terms of married-couple family poverty, the demographic groups most similar to Spanish American Indians are Guatemalan (7.0%, a difference of 0.18%), Hopi (7.1%, a difference of 0.60%), Immigrants from Nicaragua (7.1%, a difference of 0.62%), Immigrants from Dominica (7.1%, a difference of 0.68%), and Immigrants from Armenia (7.1%, a difference of 0.68%).
| Demographics | Rating | Rank | Married-Couple Family Poverty |
| Central Americans | 0.0 /100 | #301 | Tragic 6.7% |
| Immigrants | Ecuador | 0.0 /100 | #302 | Tragic 6.7% |
| Immigrants | El Salvador | 0.0 /100 | #303 | Tragic 6.8% |
| Cubans | 0.0 /100 | #304 | Tragic 6.8% |
| Haitians | 0.0 /100 | #305 | Tragic 6.8% |
| Immigrants | Haiti | 0.0 /100 | #306 | Tragic 7.0% |
| Guatemalans | 0.0 /100 | #307 | Tragic 7.0% |
| Spanish American Indians | 0.0 /100 | #308 | Tragic 7.1% |
| Hopi | 0.0 /100 | #309 | Tragic 7.1% |
| Immigrants | Nicaragua | 0.0 /100 | #310 | Tragic 7.1% |
| Immigrants | Dominica | 0.0 /100 | #311 | Tragic 7.1% |
| Immigrants | Armenia | 0.0 /100 | #312 | Tragic 7.1% |
| Immigrants | St. Vincent and the Grenadines | 0.0 /100 | #313 | Tragic 7.1% |
| British West Indians | 0.0 /100 | #314 | Tragic 7.1% |
| Inupiat | 0.0 /100 | #315 | Tragic 7.1% |
Demographics Similar to Immigrants from Eastern Africa by Married-Couple Family Poverty
In terms of married-couple family poverty, the demographic groups most similar to Immigrants from Eastern Africa are Alsatian (5.2%, a difference of 0.14%), Immigrants from Northern Africa (5.2%, a difference of 0.16%), Marshallese (5.2%, a difference of 0.24%), Menominee (5.2%, a difference of 0.25%), and Bermudan (5.2%, a difference of 0.33%).
| Demographics | Rating | Rank | Married-Couple Family Poverty |
| Costa Ricans | 61.5 /100 | #167 | Good 5.1% |
| Immigrants | Uganda | 54.9 /100 | #168 | Average 5.2% |
| Ottawa | 54.5 /100 | #169 | Average 5.2% |
| Immigrants | Argentina | 54.4 /100 | #170 | Average 5.2% |
| Bermudans | 52.9 /100 | #171 | Average 5.2% |
| Immigrants | Northern Africa | 51.3 /100 | #172 | Average 5.2% |
| Alsatians | 51.2 /100 | #173 | Average 5.2% |
| Immigrants | Eastern Africa | 50.0 /100 | #174 | Average 5.2% |
| Marshallese | 47.9 /100 | #175 | Average 5.2% |
| Menominee | 47.8 /100 | #176 | Average 5.2% |
| Immigrants | Kazakhstan | 45.1 /100 | #177 | Average 5.2% |
| Immigrants | Ukraine | 44.9 /100 | #178 | Average 5.2% |
| Spanish | 41.4 /100 | #179 | Average 5.3% |
| Immigrants | Sierra Leone | 39.3 /100 | #180 | Fair 5.3% |
| Immigrants | Chile | 38.8 /100 | #181 | Fair 5.3% |