Spanish American Indian vs Finnish Average Family Size
COMPARE
Spanish American Indian
Finnish
Average Family Size
Average Family Size Comparison
Spanish American Indians
Finns
3.58
AVERAGE FAMILY SIZE
100.0/ 100
METRIC RATING
10th/ 347
METRIC RANK
3.09
AVERAGE FAMILY SIZE
0.0/ 100
METRIC RATING
340th/ 347
METRIC RANK
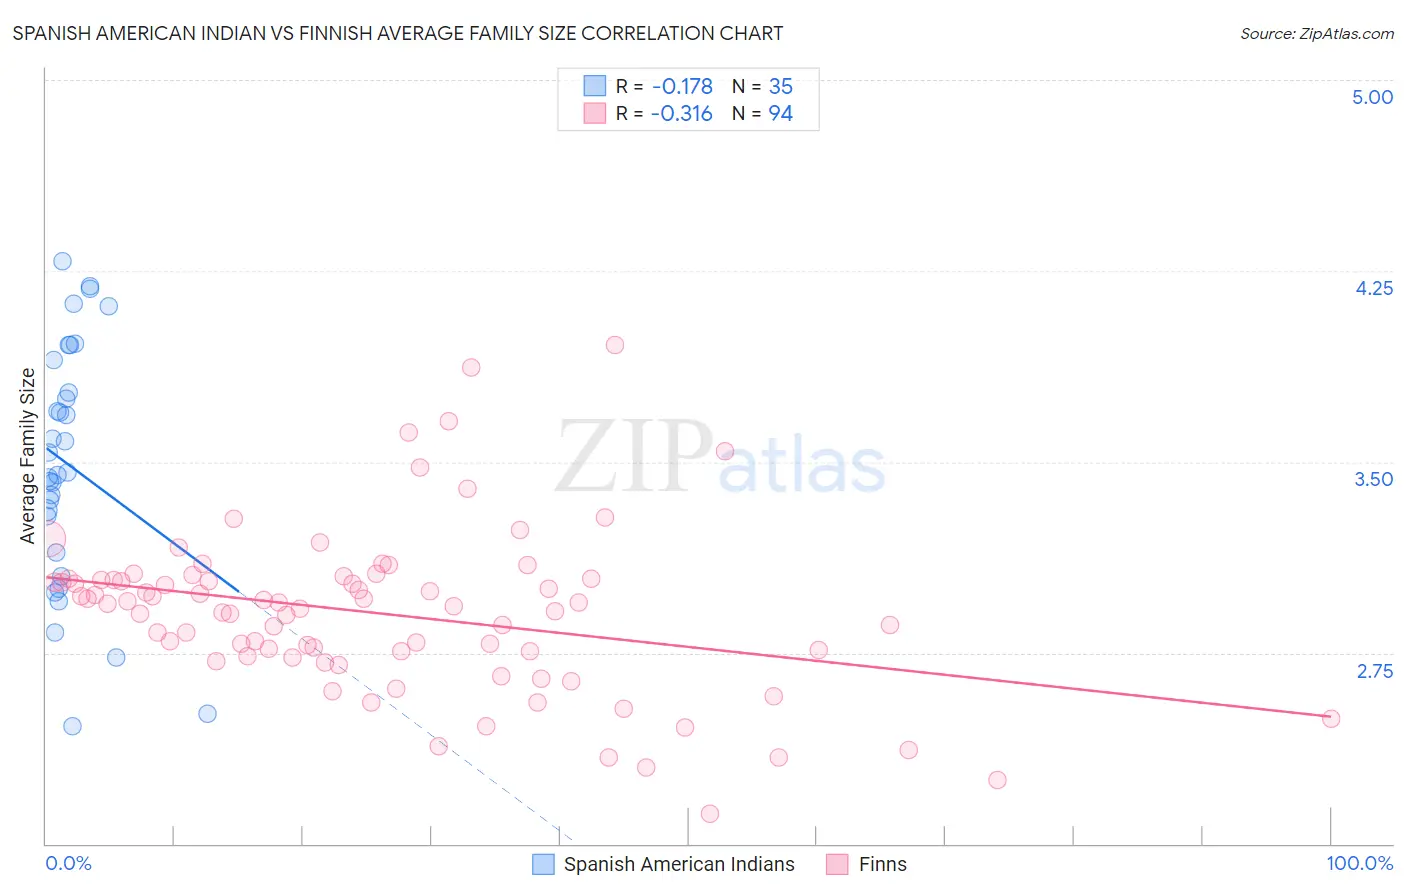
Spanish American Indian vs Finnish Average Family Size Correlation Chart
The statistical analysis conducted on geographies consisting of 73,145,550 people shows a poor negative correlation between the proportion of Spanish American Indians and average family size in the United States with a correlation coefficient (R) of -0.178 and weighted average of 3.58. Similarly, the statistical analysis conducted on geographies consisting of 404,508,275 people shows a mild negative correlation between the proportion of Finns and average family size in the United States with a correlation coefficient (R) of -0.316 and weighted average of 3.09, a difference of 15.8%.
Average Family Size Correlation Summary
| Measurement | Spanish American Indian | Finnish |
| Minimum | 2.46 | 2.12 |
| Maximum | 4.29 | 3.96 |
| Range | 1.83 | 1.84 |
| Mean | 3.49 | 2.90 |
| Median | 3.46 | 2.94 |
| Interquartile 25% (IQ1) | 3.15 | 2.74 |
| Interquartile 75% (IQ3) | 3.90 | 3.04 |
| Interquartile Range (IQR) | 0.75 | 0.30 |
| Standard Deviation (Sample) | 0.48 | 0.32 |
| Standard Deviation (Population) | 0.47 | 0.32 |
Similar Demographics by Average Family Size
Demographics Similar to Spanish American Indians by Average Family Size
In terms of average family size, the demographic groups most similar to Spanish American Indians are Hopi (3.60, a difference of 0.35%), Immigrants from Yemen (3.60, a difference of 0.36%), Inupiat (3.63, a difference of 1.2%), Arapaho (3.64, a difference of 1.4%), and Tohono O'odham (3.53, a difference of 1.4%).
| Demographics | Rating | Rank | Average Family Size |
| Pueblo | 100 /100 | #3 | Exceptional 3.79 |
| Pima | 100 /100 | #4 | Exceptional 3.75 |
| Navajo | 100.0 /100 | #5 | Exceptional 3.65 |
| Arapaho | 100.0 /100 | #6 | Exceptional 3.64 |
| Inupiat | 100.0 /100 | #7 | Exceptional 3.63 |
| Immigrants | Yemen | 100.0 /100 | #8 | Exceptional 3.60 |
| Hopi | 100.0 /100 | #9 | Exceptional 3.60 |
| Spanish American Indians | 100.0 /100 | #10 | Exceptional 3.58 |
| Tohono O'odham | 100.0 /100 | #11 | Exceptional 3.53 |
| Immigrants | Mexico | 100.0 /100 | #12 | Exceptional 3.52 |
| Sioux | 100.0 /100 | #13 | Exceptional 3.52 |
| Immigrants | Central America | 100.0 /100 | #14 | Exceptional 3.49 |
| Tongans | 100.0 /100 | #15 | Exceptional 3.49 |
| Ute | 100.0 /100 | #16 | Exceptional 3.49 |
| Immigrants | El Salvador | 100.0 /100 | #17 | Exceptional 3.49 |
Demographics Similar to Finns by Average Family Size
In terms of average family size, the demographic groups most similar to Finns are Polish (3.09, a difference of 0.050%), Croatian (3.10, a difference of 0.14%), French (3.10, a difference of 0.16%), Swedish (3.10, a difference of 0.18%), and German (3.09, a difference of 0.19%).
| Demographics | Rating | Rank | Average Family Size |
| Estonians | 0.0 /100 | #333 | Tragic 3.10 |
| Lithuanians | 0.0 /100 | #334 | Tragic 3.10 |
| Luxembourgers | 0.0 /100 | #335 | Tragic 3.10 |
| Irish | 0.0 /100 | #336 | Tragic 3.10 |
| Swedes | 0.0 /100 | #337 | Tragic 3.10 |
| French | 0.0 /100 | #338 | Tragic 3.10 |
| Croatians | 0.0 /100 | #339 | Tragic 3.10 |
| Finns | 0.0 /100 | #340 | Tragic 3.09 |
| Poles | 0.0 /100 | #341 | Tragic 3.09 |
| Germans | 0.0 /100 | #342 | Tragic 3.09 |
| Norwegians | 0.0 /100 | #343 | Tragic 3.08 |
| French Canadians | 0.0 /100 | #344 | Tragic 3.07 |
| Slovenes | 0.0 /100 | #345 | Tragic 3.07 |
| Slovaks | 0.0 /100 | #346 | Tragic 3.06 |
| Carpatho Rusyns | 0.0 /100 | #347 | Tragic 3.06 |