Spanish American Indian vs Immigrants from North Macedonia Married-Couple Family Poverty
COMPARE
Spanish American Indian
Immigrants from North Macedonia
Married-Couple Family Poverty
Married-Couple Family Poverty Comparison
Spanish American Indians
Immigrants from North Macedonia
7.1%
MARRIED-COUPLE FAMILY POVERTY
0.0/ 100
METRIC RATING
308th/ 347
METRIC RANK
4.6%
MARRIED-COUPLE FAMILY POVERTY
98.6/ 100
METRIC RATING
87th/ 347
METRIC RANK
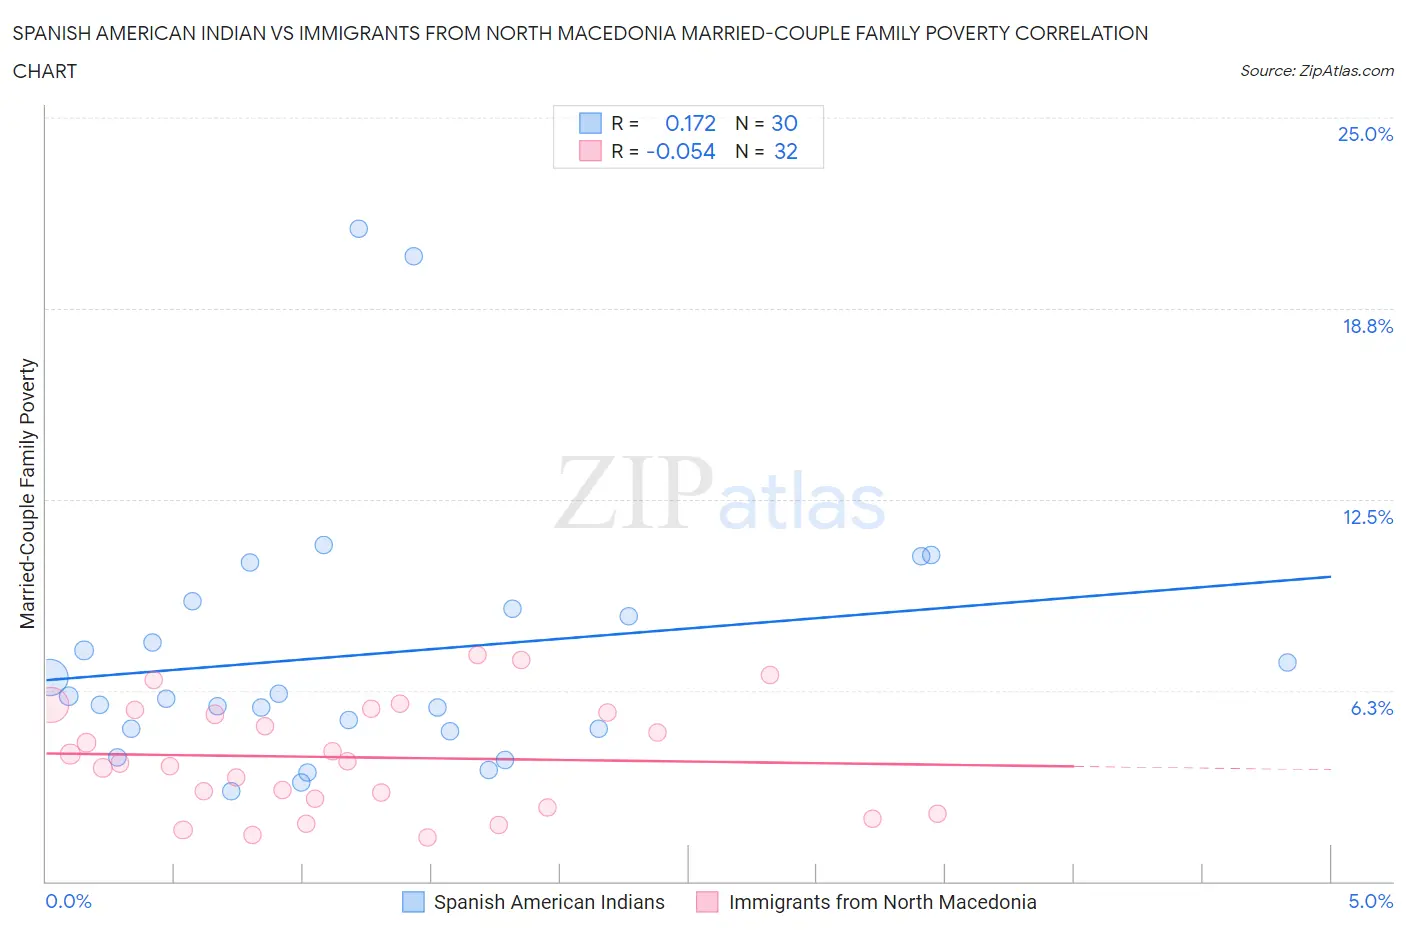
Spanish American Indian vs Immigrants from North Macedonia Married-Couple Family Poverty Correlation Chart
The statistical analysis conducted on geographies consisting of 73,069,372 people shows a poor positive correlation between the proportion of Spanish American Indians and poverty level among married-couple families in the United States with a correlation coefficient (R) of 0.172 and weighted average of 7.1%. Similarly, the statistical analysis conducted on geographies consisting of 73,997,704 people shows a slight negative correlation between the proportion of Immigrants from North Macedonia and poverty level among married-couple families in the United States with a correlation coefficient (R) of -0.054 and weighted average of 4.6%, a difference of 54.2%.
Married-Couple Family Poverty Correlation Summary
| Measurement | Spanish American Indian | Immigrants from North Macedonia |
| Minimum | 3.0% | 1.4% |
| Maximum | 21.3% | 7.4% |
| Range | 18.4% | 6.0% |
| Mean | 7.4% | 4.1% |
| Median | 6.0% | 3.9% |
| Interquartile 25% (IQ1) | 5.0% | 2.6% |
| Interquartile 75% (IQ3) | 8.9% | 5.6% |
| Interquartile Range (IQR) | 3.9% | 3.0% |
| Standard Deviation (Sample) | 4.3% | 1.8% |
| Standard Deviation (Population) | 4.3% | 1.7% |
Similar Demographics by Married-Couple Family Poverty
Demographics Similar to Spanish American Indians by Married-Couple Family Poverty
In terms of married-couple family poverty, the demographic groups most similar to Spanish American Indians are Guatemalan (7.0%, a difference of 0.18%), Hopi (7.1%, a difference of 0.60%), Immigrants from Nicaragua (7.1%, a difference of 0.62%), Immigrants from Dominica (7.1%, a difference of 0.68%), and Immigrants from Armenia (7.1%, a difference of 0.68%).
| Demographics | Rating | Rank | Married-Couple Family Poverty |
| Central Americans | 0.0 /100 | #301 | Tragic 6.7% |
| Immigrants | Ecuador | 0.0 /100 | #302 | Tragic 6.7% |
| Immigrants | El Salvador | 0.0 /100 | #303 | Tragic 6.8% |
| Cubans | 0.0 /100 | #304 | Tragic 6.8% |
| Haitians | 0.0 /100 | #305 | Tragic 6.8% |
| Immigrants | Haiti | 0.0 /100 | #306 | Tragic 7.0% |
| Guatemalans | 0.0 /100 | #307 | Tragic 7.0% |
| Spanish American Indians | 0.0 /100 | #308 | Tragic 7.1% |
| Hopi | 0.0 /100 | #309 | Tragic 7.1% |
| Immigrants | Nicaragua | 0.0 /100 | #310 | Tragic 7.1% |
| Immigrants | Dominica | 0.0 /100 | #311 | Tragic 7.1% |
| Immigrants | Armenia | 0.0 /100 | #312 | Tragic 7.1% |
| Immigrants | St. Vincent and the Grenadines | 0.0 /100 | #313 | Tragic 7.1% |
| British West Indians | 0.0 /100 | #314 | Tragic 7.1% |
| Inupiat | 0.0 /100 | #315 | Tragic 7.1% |
Demographics Similar to Immigrants from North Macedonia by Married-Couple Family Poverty
In terms of married-couple family poverty, the demographic groups most similar to Immigrants from North Macedonia are Immigrants from Turkey (4.6%, a difference of 0.080%), Bolivian (4.6%, a difference of 0.10%), South African (4.6%, a difference of 0.12%), Immigrants from Czechoslovakia (4.6%, a difference of 0.21%), and Immigrants from Switzerland (4.6%, a difference of 0.28%).
| Demographics | Rating | Rank | Married-Couple Family Poverty |
| Icelanders | 99.0 /100 | #80 | Exceptional 4.5% |
| Immigrants | Greece | 98.9 /100 | #81 | Exceptional 4.5% |
| Canadians | 98.8 /100 | #82 | Exceptional 4.5% |
| Immigrants | Denmark | 98.8 /100 | #83 | Exceptional 4.6% |
| Immigrants | Croatia | 98.7 /100 | #84 | Exceptional 4.6% |
| South Africans | 98.7 /100 | #85 | Exceptional 4.6% |
| Immigrants | Turkey | 98.6 /100 | #86 | Exceptional 4.6% |
| Immigrants | North Macedonia | 98.6 /100 | #87 | Exceptional 4.6% |
| Bolivians | 98.6 /100 | #88 | Exceptional 4.6% |
| Immigrants | Czechoslovakia | 98.5 /100 | #89 | Exceptional 4.6% |
| Immigrants | Switzerland | 98.5 /100 | #90 | Exceptional 4.6% |
| Basques | 98.5 /100 | #91 | Exceptional 4.6% |
| Immigrants | Norway | 98.4 /100 | #92 | Exceptional 4.6% |
| Koreans | 98.3 /100 | #93 | Exceptional 4.6% |
| Immigrants | Italy | 98.3 /100 | #94 | Exceptional 4.6% |