Potawatomi vs Immigrants from Albania Female Poverty
COMPARE
Potawatomi
Immigrants from Albania
Female Poverty
Female Poverty Comparison
Potawatomi
Immigrants from Albania
15.3%
FEMALE POVERTY
0.3/ 100
METRIC RATING
247th/ 347
METRIC RANK
13.3%
FEMALE POVERTY
62.4/ 100
METRIC RATING
163rd/ 347
METRIC RANK
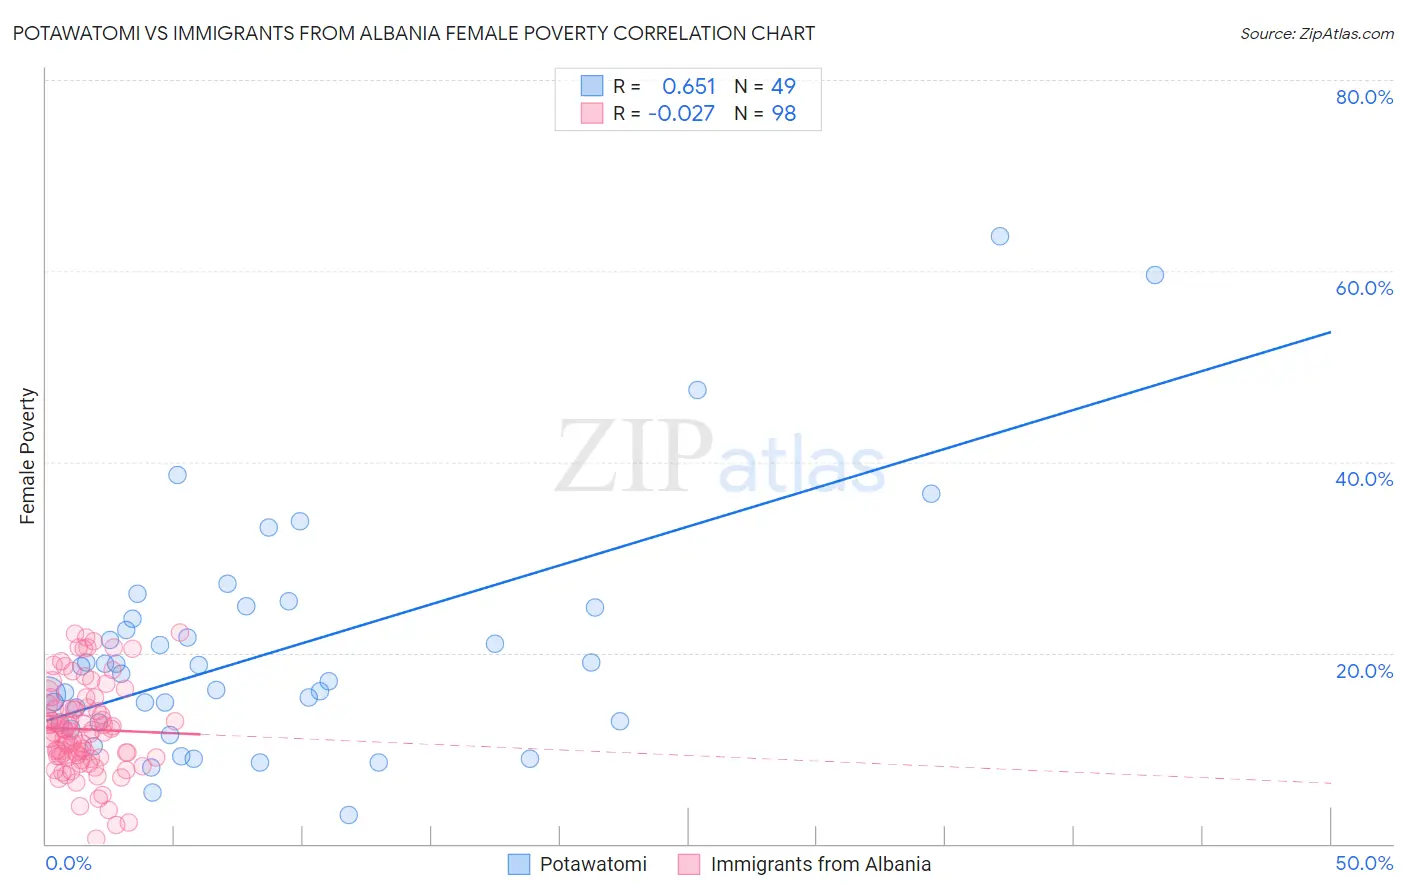
Potawatomi vs Immigrants from Albania Female Poverty Correlation Chart
The statistical analysis conducted on geographies consisting of 117,742,920 people shows a significant positive correlation between the proportion of Potawatomi and poverty level among females in the United States with a correlation coefficient (R) of 0.651 and weighted average of 15.3%. Similarly, the statistical analysis conducted on geographies consisting of 119,347,063 people shows no correlation between the proportion of Immigrants from Albania and poverty level among females in the United States with a correlation coefficient (R) of -0.027 and weighted average of 13.3%, a difference of 15.3%.
Female Poverty Correlation Summary
| Measurement | Potawatomi | Immigrants from Albania |
| Minimum | 3.1% | 0.46% |
| Maximum | 63.6% | 22.1% |
| Range | 60.6% | 21.6% |
| Mean | 20.2% | 12.0% |
| Median | 17.8% | 11.7% |
| Interquartile 25% (IQ1) | 12.7% | 9.0% |
| Interquartile 75% (IQ3) | 24.2% | 14.3% |
| Interquartile Range (IQR) | 11.5% | 5.2% |
| Standard Deviation (Sample) | 12.3% | 4.7% |
| Standard Deviation (Population) | 12.2% | 4.7% |
Similar Demographics by Female Poverty
Demographics Similar to Potawatomi by Female Poverty
In terms of female poverty, the demographic groups most similar to Potawatomi are Immigrants from Ghana (15.3%, a difference of 0.0%), Cuban (15.3%, a difference of 0.010%), Spanish American Indian (15.3%, a difference of 0.060%), Salvadoran (15.3%, a difference of 0.14%), and Ecuadorian (15.3%, a difference of 0.16%).
| Demographics | Rating | Rank | Female Poverty |
| Sudanese | 0.5 /100 | #240 | Tragic 15.2% |
| Immigrants | Sudan | 0.4 /100 | #241 | Tragic 15.2% |
| Nepalese | 0.4 /100 | #242 | Tragic 15.2% |
| Nicaraguans | 0.3 /100 | #243 | Tragic 15.3% |
| Ecuadorians | 0.3 /100 | #244 | Tragic 15.3% |
| Spanish American Indians | 0.3 /100 | #245 | Tragic 15.3% |
| Cubans | 0.3 /100 | #246 | Tragic 15.3% |
| Potawatomi | 0.3 /100 | #247 | Tragic 15.3% |
| Immigrants | Ghana | 0.3 /100 | #248 | Tragic 15.3% |
| Salvadorans | 0.3 /100 | #249 | Tragic 15.3% |
| Immigrants | Western Africa | 0.3 /100 | #250 | Tragic 15.3% |
| Immigrants | Trinidad and Tobago | 0.3 /100 | #251 | Tragic 15.4% |
| Immigrants | Burma/Myanmar | 0.3 /100 | #252 | Tragic 15.4% |
| Liberians | 0.2 /100 | #253 | Tragic 15.4% |
| Trinidadians and Tobagonians | 0.2 /100 | #254 | Tragic 15.4% |
Demographics Similar to Immigrants from Albania by Female Poverty
In terms of female poverty, the demographic groups most similar to Immigrants from Albania are Guamanian/Chamorro (13.3%, a difference of 0.0%), Immigrants from Ethiopia (13.3%, a difference of 0.010%), Ethiopian (13.3%, a difference of 0.010%), Scotch-Irish (13.3%, a difference of 0.030%), and Immigrants from Nepal (13.3%, a difference of 0.040%).
| Demographics | Rating | Rank | Female Poverty |
| Immigrants | Bosnia and Herzegovina | 69.7 /100 | #156 | Good 13.2% |
| Immigrants | Northern Africa | 68.8 /100 | #157 | Good 13.2% |
| Pennsylvania Germans | 67.3 /100 | #158 | Good 13.2% |
| Costa Ricans | 63.6 /100 | #159 | Good 13.3% |
| Immigrants | Nepal | 62.7 /100 | #160 | Good 13.3% |
| Immigrants | Ethiopia | 62.5 /100 | #161 | Good 13.3% |
| Guamanians/Chamorros | 62.4 /100 | #162 | Good 13.3% |
| Immigrants | Albania | 62.4 /100 | #163 | Good 13.3% |
| Ethiopians | 62.3 /100 | #164 | Good 13.3% |
| Scotch-Irish | 62.1 /100 | #165 | Good 13.3% |
| Immigrants | Oceania | 59.7 /100 | #166 | Average 13.3% |
| Immigrants | Chile | 57.4 /100 | #167 | Average 13.3% |
| Aleuts | 56.7 /100 | #168 | Average 13.4% |
| Lebanese | 55.9 /100 | #169 | Average 13.4% |
| Colombians | 55.7 /100 | #170 | Average 13.4% |