Potawatomi vs Nigerian Female Poverty
COMPARE
Potawatomi
Nigerian
Female Poverty
Female Poverty Comparison
Potawatomi
Nigerians
15.3%
FEMALE POVERTY
0.3/ 100
METRIC RATING
247th/ 347
METRIC RANK
14.8%
FEMALE POVERTY
1.7/ 100
METRIC RATING
231st/ 347
METRIC RANK
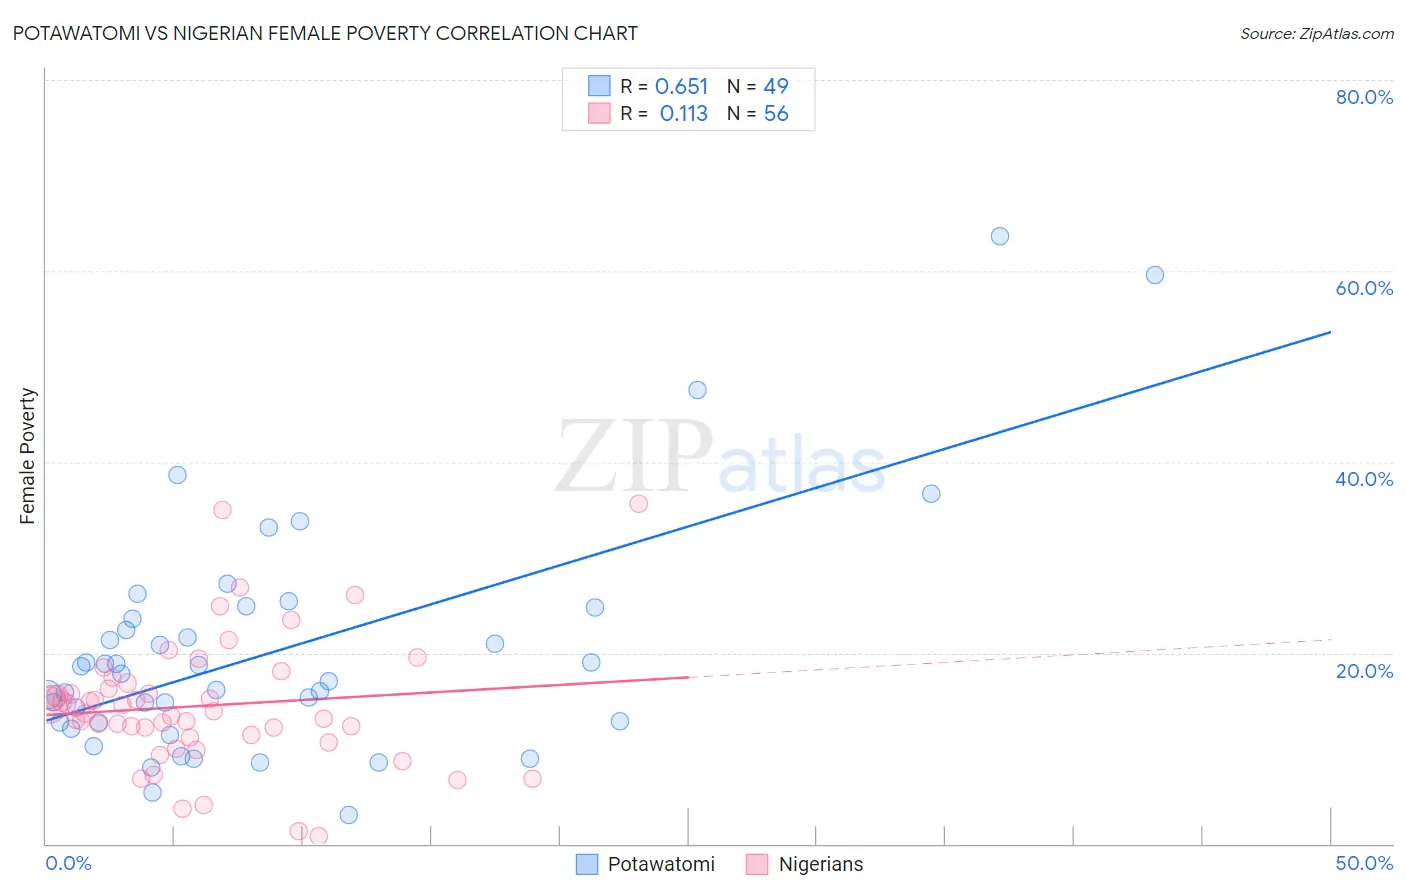
Potawatomi vs Nigerian Female Poverty Correlation Chart
The statistical analysis conducted on geographies consisting of 117,742,920 people shows a significant positive correlation between the proportion of Potawatomi and poverty level among females in the United States with a correlation coefficient (R) of 0.651 and weighted average of 15.3%. Similarly, the statistical analysis conducted on geographies consisting of 332,444,319 people shows a poor positive correlation between the proportion of Nigerians and poverty level among females in the United States with a correlation coefficient (R) of 0.113 and weighted average of 14.8%, a difference of 3.7%.
Female Poverty Correlation Summary
| Measurement | Potawatomi | Nigerian |
| Minimum | 3.1% | 0.81% |
| Maximum | 63.6% | 35.6% |
| Range | 60.6% | 34.7% |
| Mean | 20.2% | 14.4% |
| Median | 17.8% | 13.8% |
| Interquartile 25% (IQ1) | 12.7% | 11.3% |
| Interquartile 75% (IQ3) | 24.2% | 16.6% |
| Interquartile Range (IQR) | 11.5% | 5.3% |
| Standard Deviation (Sample) | 12.3% | 6.8% |
| Standard Deviation (Population) | 12.2% | 6.7% |
Demographics Similar to Potawatomi and Nigerians by Female Poverty
In terms of female poverty, the demographic groups most similar to Potawatomi are Immigrants from Ghana (15.3%, a difference of 0.0%), Cuban (15.3%, a difference of 0.010%), Spanish American Indian (15.3%, a difference of 0.060%), Salvadoran (15.3%, a difference of 0.14%), and Ecuadorian (15.3%, a difference of 0.16%). Similarly, the demographic groups most similar to Nigerians are Alaska Native (14.7%, a difference of 0.10%), Ghanaian (14.7%, a difference of 0.30%), Osage (14.8%, a difference of 0.31%), Immigrants from Saudi Arabia (14.8%, a difference of 0.41%), and Fijian (14.9%, a difference of 0.93%).
| Demographics | Rating | Rank | Female Poverty |
| Ghanaians | 1.9 /100 | #229 | Tragic 14.7% |
| Alaska Natives | 1.8 /100 | #230 | Tragic 14.7% |
| Nigerians | 1.7 /100 | #231 | Tragic 14.8% |
| Osage | 1.5 /100 | #232 | Tragic 14.8% |
| Immigrants | Saudi Arabia | 1.4 /100 | #233 | Tragic 14.8% |
| Fijians | 1.1 /100 | #234 | Tragic 14.9% |
| Immigrants | Laos | 0.9 /100 | #235 | Tragic 15.0% |
| Cree | 0.7 /100 | #236 | Tragic 15.1% |
| French American Indians | 0.6 /100 | #237 | Tragic 15.1% |
| Immigrants | Armenia | 0.6 /100 | #238 | Tragic 15.1% |
| Immigrants | Middle Africa | 0.5 /100 | #239 | Tragic 15.2% |
| Sudanese | 0.5 /100 | #240 | Tragic 15.2% |
| Immigrants | Sudan | 0.4 /100 | #241 | Tragic 15.2% |
| Nepalese | 0.4 /100 | #242 | Tragic 15.2% |
| Nicaraguans | 0.3 /100 | #243 | Tragic 15.3% |
| Ecuadorians | 0.3 /100 | #244 | Tragic 15.3% |
| Spanish American Indians | 0.3 /100 | #245 | Tragic 15.3% |
| Cubans | 0.3 /100 | #246 | Tragic 15.3% |
| Potawatomi | 0.3 /100 | #247 | Tragic 15.3% |
| Immigrants | Ghana | 0.3 /100 | #248 | Tragic 15.3% |
| Salvadorans | 0.3 /100 | #249 | Tragic 15.3% |