Maltese vs Trinidadian and Tobagonian Family Poverty
COMPARE
Maltese
Trinidadian and Tobagonian
Family Poverty
Family Poverty Comparison
Maltese
Trinidadians and Tobagonians
7.1%
FAMILY POVERTY
99.8/ 100
METRIC RATING
12th/ 347
METRIC RANK
10.9%
FAMILY POVERTY
0.1/ 100
METRIC RATING
264th/ 347
METRIC RANK
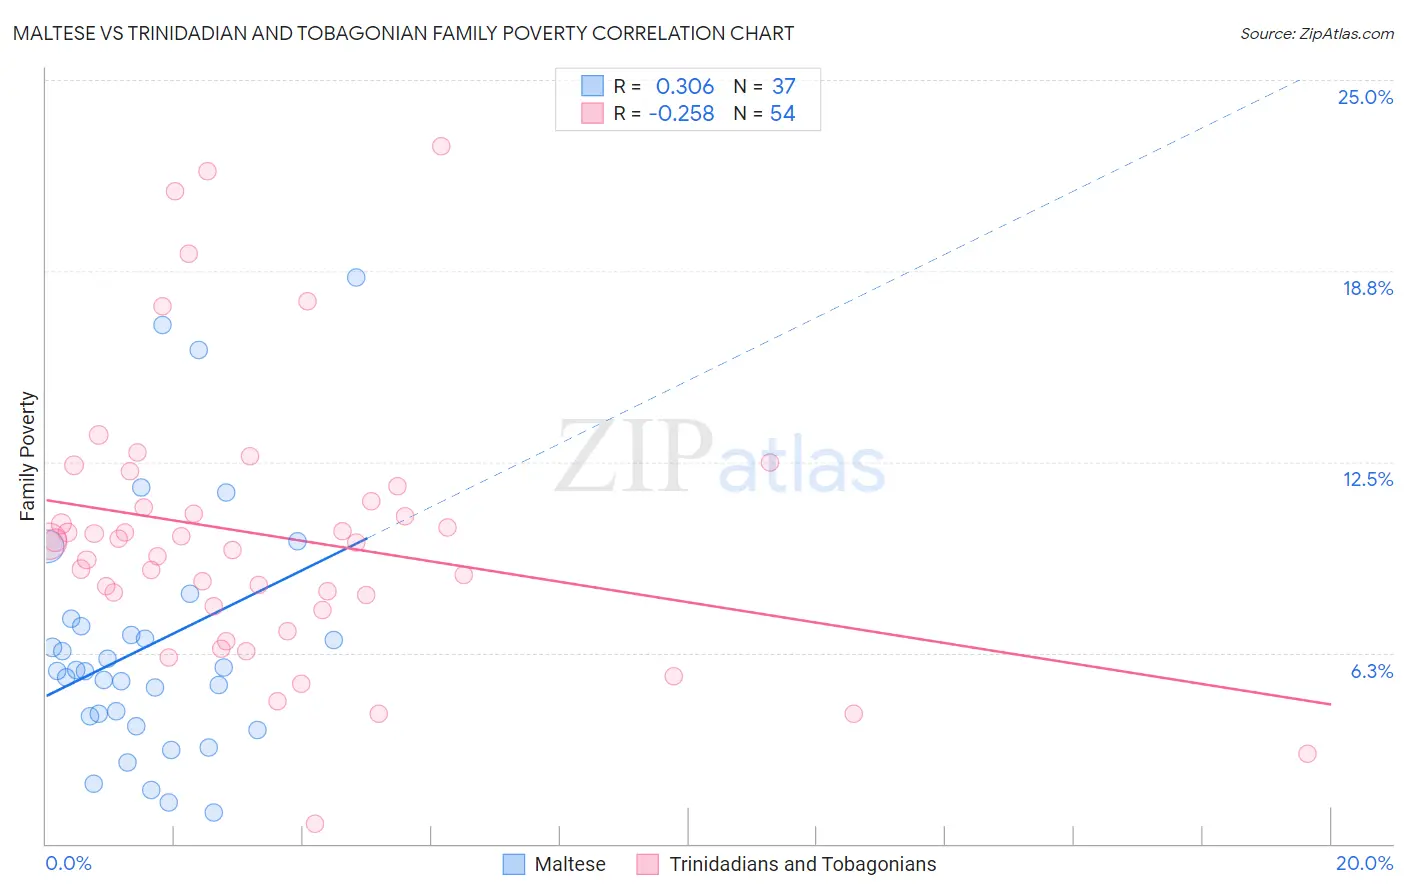
Maltese vs Trinidadian and Tobagonian Family Poverty Correlation Chart
The statistical analysis conducted on geographies consisting of 126,303,911 people shows a mild positive correlation between the proportion of Maltese and poverty level among families in the United States with a correlation coefficient (R) of 0.306 and weighted average of 7.1%. Similarly, the statistical analysis conducted on geographies consisting of 219,444,154 people shows a weak negative correlation between the proportion of Trinidadians and Tobagonians and poverty level among families in the United States with a correlation coefficient (R) of -0.258 and weighted average of 10.9%, a difference of 53.7%.
Family Poverty Correlation Summary
| Measurement | Maltese | Trinidadian and Tobagonian |
| Minimum | 1.0% | 0.64% |
| Maximum | 18.6% | 22.8% |
| Range | 17.5% | 22.2% |
| Mean | 6.5% | 10.1% |
| Median | 5.7% | 9.9% |
| Interquartile 25% (IQ1) | 4.0% | 7.8% |
| Interquartile 75% (IQ3) | 7.2% | 11.2% |
| Interquartile Range (IQR) | 3.2% | 3.5% |
| Standard Deviation (Sample) | 4.1% | 4.5% |
| Standard Deviation (Population) | 4.0% | 4.4% |
Similar Demographics by Family Poverty
Demographics Similar to Maltese by Family Poverty
In terms of family poverty, the demographic groups most similar to Maltese are Swedish (7.1%, a difference of 0.050%), Iranian (7.1%, a difference of 0.060%), Immigrants from Singapore (7.1%, a difference of 0.29%), Bulgarian (7.1%, a difference of 0.30%), and Latvian (7.1%, a difference of 0.55%).
| Demographics | Rating | Rank | Family Poverty |
| Thais | 100.0 /100 | #5 | Exceptional 6.7% |
| Norwegians | 99.9 /100 | #6 | Exceptional 6.9% |
| Immigrants | Ireland | 99.9 /100 | #7 | Exceptional 7.0% |
| Bhutanese | 99.9 /100 | #8 | Exceptional 7.0% |
| Latvians | 99.9 /100 | #9 | Exceptional 7.1% |
| Bulgarians | 99.8 /100 | #10 | Exceptional 7.1% |
| Immigrants | Singapore | 99.8 /100 | #11 | Exceptional 7.1% |
| Maltese | 99.8 /100 | #12 | Exceptional 7.1% |
| Swedes | 99.8 /100 | #13 | Exceptional 7.1% |
| Iranians | 99.8 /100 | #14 | Exceptional 7.1% |
| Lithuanians | 99.8 /100 | #15 | Exceptional 7.2% |
| Immigrants | South Central Asia | 99.8 /100 | #16 | Exceptional 7.2% |
| Luxembourgers | 99.8 /100 | #17 | Exceptional 7.2% |
| Immigrants | Lithuania | 99.8 /100 | #18 | Exceptional 7.2% |
| Eastern Europeans | 99.7 /100 | #19 | Exceptional 7.2% |
Demographics Similar to Trinidadians and Tobagonians by Family Poverty
In terms of family poverty, the demographic groups most similar to Trinidadians and Tobagonians are Cape Verdean (10.9%, a difference of 0.020%), Immigrants from Trinidad and Tobago (10.9%, a difference of 0.060%), Spanish American Indian (10.9%, a difference of 0.28%), Shoshone (10.9%, a difference of 0.41%), and Bangladeshi (10.9%, a difference of 0.44%).
| Demographics | Rating | Rank | Family Poverty |
| Immigrants | Ghana | 0.2 /100 | #257 | Tragic 10.8% |
| Sub-Saharan Africans | 0.2 /100 | #258 | Tragic 10.9% |
| Mexican American Indians | 0.2 /100 | #259 | Tragic 10.9% |
| Bangladeshis | 0.2 /100 | #260 | Tragic 10.9% |
| Shoshone | 0.2 /100 | #261 | Tragic 10.9% |
| Spanish American Indians | 0.2 /100 | #262 | Tragic 10.9% |
| Cape Verdeans | 0.1 /100 | #263 | Tragic 10.9% |
| Trinidadians and Tobagonians | 0.1 /100 | #264 | Tragic 10.9% |
| Immigrants | Trinidad and Tobago | 0.1 /100 | #265 | Tragic 10.9% |
| Immigrants | El Salvador | 0.1 /100 | #266 | Tragic 11.0% |
| Comanche | 0.1 /100 | #267 | Tragic 11.0% |
| Jamaicans | 0.1 /100 | #268 | Tragic 11.1% |
| Immigrants | Ecuador | 0.1 /100 | #269 | Tragic 11.1% |
| Immigrants | Nicaragua | 0.1 /100 | #270 | Tragic 11.1% |
| Immigrants | Bahamas | 0.1 /100 | #271 | Tragic 11.1% |