Maltese vs Trinidadian and Tobagonian Hearing Disability
COMPARE
Maltese
Trinidadian and Tobagonian
Hearing Disability
Hearing Disability Comparison
Maltese
Trinidadians and Tobagonians
3.2%
HEARING DISABILITY
4.1/ 100
METRIC RATING
229th/ 347
METRIC RANK
2.5%
HEARING DISABILITY
99.9/ 100
METRIC RATING
12th/ 347
METRIC RANK
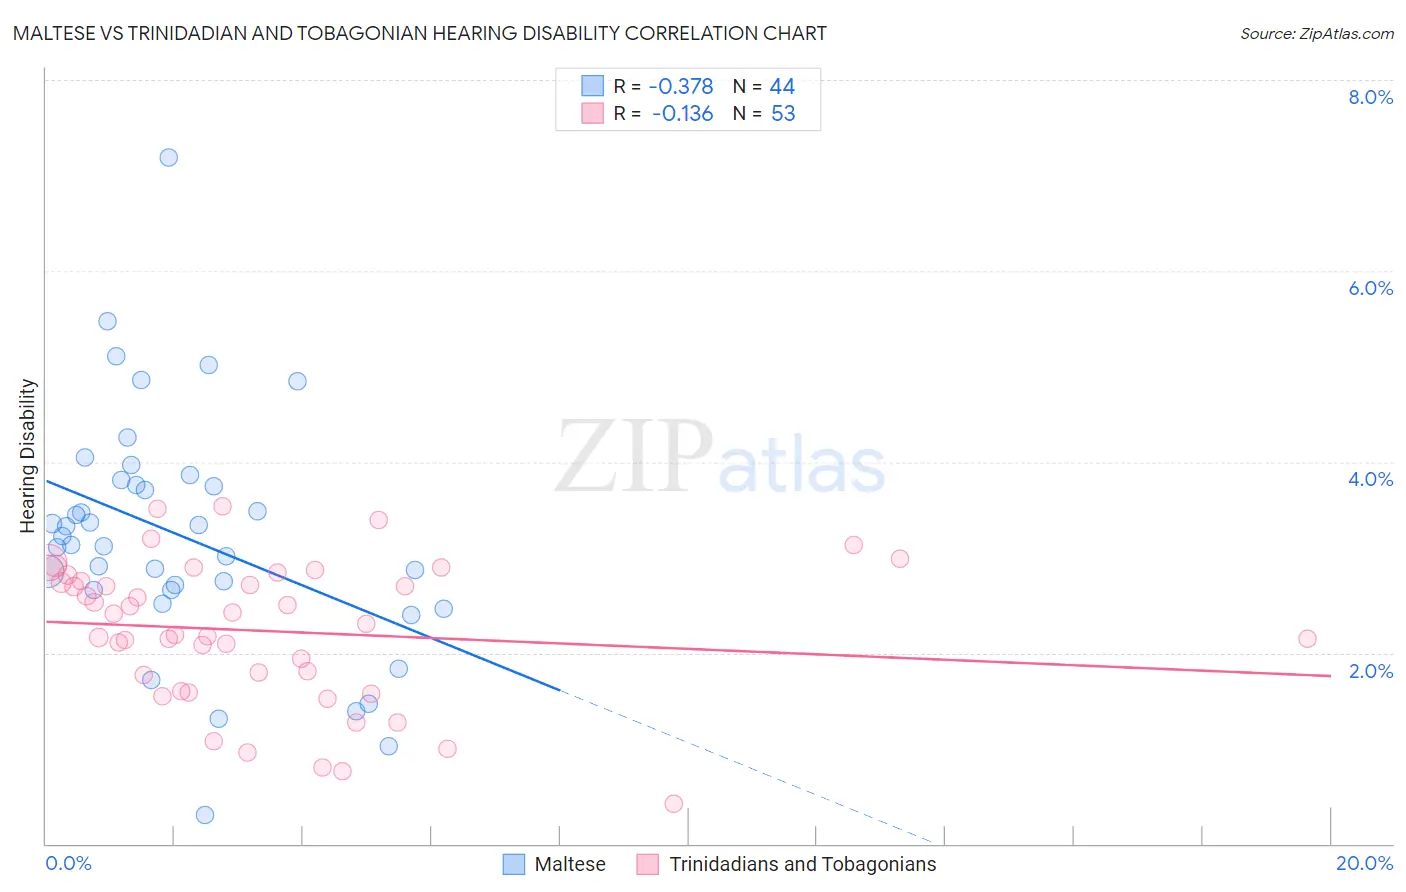
Maltese vs Trinidadian and Tobagonian Hearing Disability Correlation Chart
The statistical analysis conducted on geographies consisting of 126,465,579 people shows a mild negative correlation between the proportion of Maltese and percentage of population with hearing disability in the United States with a correlation coefficient (R) of -0.378 and weighted average of 3.2%. Similarly, the statistical analysis conducted on geographies consisting of 219,769,787 people shows a poor negative correlation between the proportion of Trinidadians and Tobagonians and percentage of population with hearing disability in the United States with a correlation coefficient (R) of -0.136 and weighted average of 2.5%, a difference of 28.9%.
Hearing Disability Correlation Summary
| Measurement | Maltese | Trinidadian and Tobagonian |
| Minimum | 0.30% | 0.42% |
| Maximum | 7.2% | 3.5% |
| Range | 6.9% | 3.1% |
| Mean | 3.2% | 2.2% |
| Median | 3.2% | 2.3% |
| Interquartile 25% (IQ1) | 2.7% | 1.7% |
| Interquartile 75% (IQ3) | 3.8% | 2.8% |
| Interquartile Range (IQR) | 1.1% | 1.1% |
| Standard Deviation (Sample) | 1.3% | 0.74% |
| Standard Deviation (Population) | 1.2% | 0.74% |
Similar Demographics by Hearing Disability
Demographics Similar to Maltese by Hearing Disability
In terms of hearing disability, the demographic groups most similar to Maltese are Immigrants from Portugal (3.2%, a difference of 0.11%), Bhutanese (3.2%, a difference of 0.30%), Lebanese (3.2%, a difference of 0.49%), Greek (3.2%, a difference of 0.51%), and Latvian (3.2%, a difference of 0.53%).
| Demographics | Rating | Rank | Hearing Disability |
| Immigrants | Oceania | 6.5 /100 | #222 | Tragic 3.2% |
| Mexicans | 5.6 /100 | #223 | Tragic 3.2% |
| Icelanders | 5.2 /100 | #224 | Tragic 3.2% |
| Latvians | 5.1 /100 | #225 | Tragic 3.2% |
| Lebanese | 5.0 /100 | #226 | Tragic 3.2% |
| Bhutanese | 4.6 /100 | #227 | Tragic 3.2% |
| Immigrants | Portugal | 4.3 /100 | #228 | Tragic 3.2% |
| Maltese | 4.1 /100 | #229 | Tragic 3.2% |
| Greeks | 3.2 /100 | #230 | Tragic 3.2% |
| Luxembourgers | 2.9 /100 | #231 | Tragic 3.2% |
| Ukrainians | 2.9 /100 | #232 | Tragic 3.2% |
| Estonians | 2.4 /100 | #233 | Tragic 3.3% |
| Central American Indians | 2.3 /100 | #234 | Tragic 3.3% |
| Guamanians/Chamorros | 2.2 /100 | #235 | Tragic 3.3% |
| Serbians | 2.2 /100 | #236 | Tragic 3.3% |
Demographics Similar to Trinidadians and Tobagonians by Hearing Disability
In terms of hearing disability, the demographic groups most similar to Trinidadians and Tobagonians are Sierra Leonean (2.5%, a difference of 0.22%), Immigrants from Trinidad and Tobago (2.5%, a difference of 0.30%), Ecuadorian (2.5%, a difference of 0.54%), Barbadian (2.5%, a difference of 0.85%), and Immigrants from Ecuador (2.5%, a difference of 0.86%).
| Demographics | Rating | Rank | Hearing Disability |
| Immigrants | Barbados | 100.0 /100 | #5 | Exceptional 2.4% |
| Vietnamese | 100.0 /100 | #6 | Exceptional 2.4% |
| Immigrants | Bangladesh | 100.0 /100 | #7 | Exceptional 2.4% |
| British West Indians | 100.0 /100 | #8 | Exceptional 2.4% |
| Immigrants | Dominican Republic | 100.0 /100 | #9 | Exceptional 2.4% |
| Immigrants | Ecuador | 99.9 /100 | #10 | Exceptional 2.5% |
| Immigrants | Trinidad and Tobago | 99.9 /100 | #11 | Exceptional 2.5% |
| Trinidadians and Tobagonians | 99.9 /100 | #12 | Exceptional 2.5% |
| Sierra Leoneans | 99.9 /100 | #13 | Exceptional 2.5% |
| Ecuadorians | 99.9 /100 | #14 | Exceptional 2.5% |
| Barbadians | 99.9 /100 | #15 | Exceptional 2.5% |
| Immigrants | West Indies | 99.9 /100 | #16 | Exceptional 2.5% |
| Immigrants | India | 99.9 /100 | #17 | Exceptional 2.5% |
| Dominicans | 99.8 /100 | #18 | Exceptional 2.5% |
| Thais | 99.8 /100 | #19 | Exceptional 2.5% |