Lumbee vs Paiute Single Mother Poverty
COMPARE
Lumbee
Paiute
Single Mother Poverty
Single Mother Poverty Comparison
Lumbee
Paiute
43.2%
SINGLE MOTHER POVERTY
0.0/ 100
METRIC RATING
345th/ 347
METRIC RANK
35.1%
SINGLE MOTHER POVERTY
0.0/ 100
METRIC RATING
321st/ 347
METRIC RANK
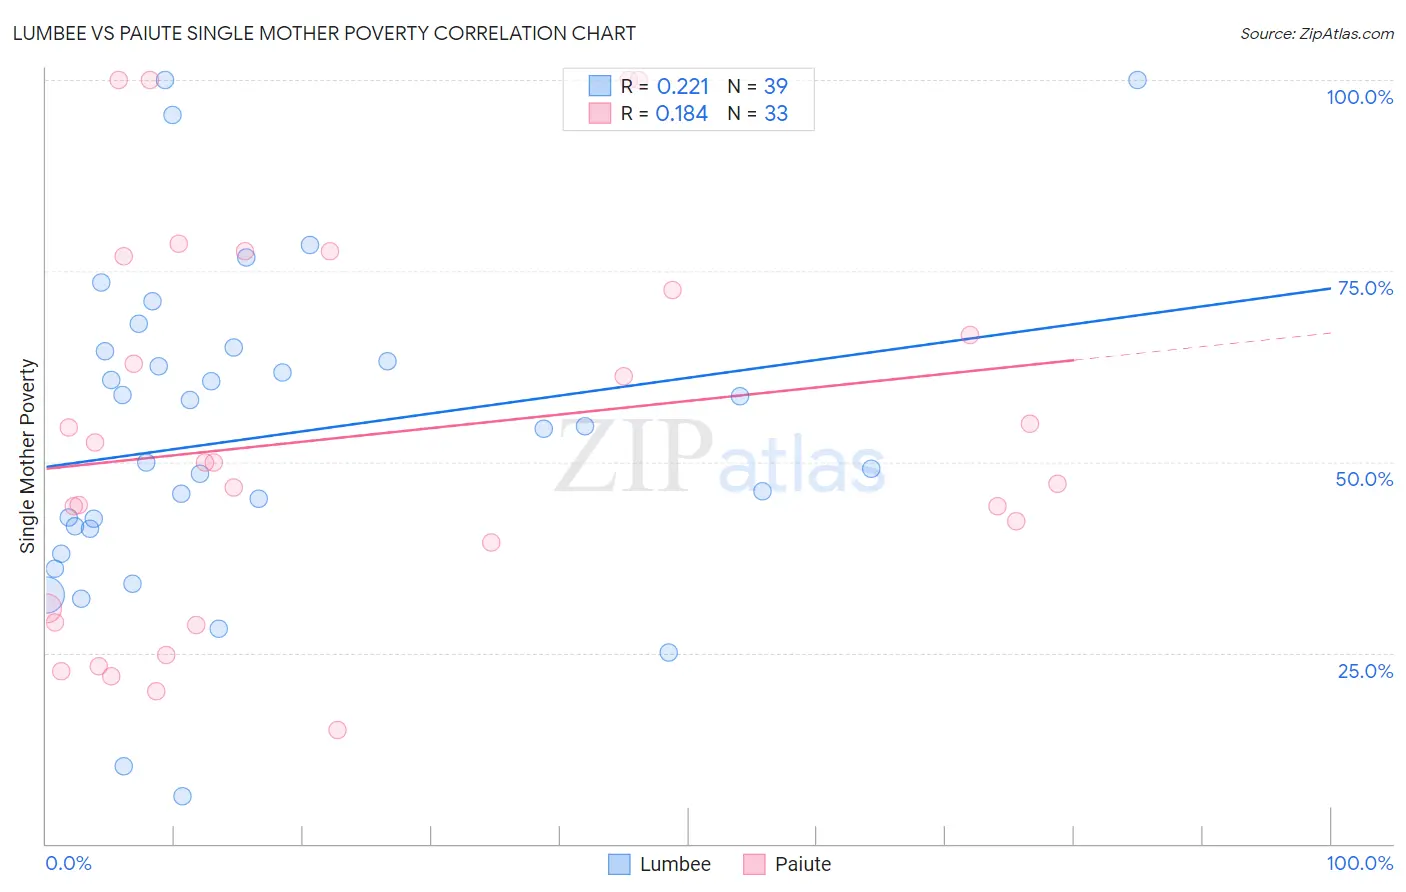
Lumbee vs Paiute Single Mother Poverty Correlation Chart
The statistical analysis conducted on geographies consisting of 91,530,918 people shows a weak positive correlation between the proportion of Lumbee and poverty level among single mothers in the United States with a correlation coefficient (R) of 0.221 and weighted average of 43.2%. Similarly, the statistical analysis conducted on geographies consisting of 58,096,720 people shows a poor positive correlation between the proportion of Paiute and poverty level among single mothers in the United States with a correlation coefficient (R) of 0.184 and weighted average of 35.1%, a difference of 23.1%.
Single Mother Poverty Correlation Summary
| Measurement | Lumbee | Paiute |
| Minimum | 6.2% | 14.8% |
| Maximum | 100.0% | 100.0% |
| Range | 93.8% | 85.2% |
| Mean | 53.4% | 53.3% |
| Median | 54.4% | 50.0% |
| Interquartile 25% (IQ1) | 41.2% | 29.9% |
| Interquartile 75% (IQ3) | 64.5% | 74.7% |
| Interquartile Range (IQR) | 23.4% | 44.8% |
| Standard Deviation (Sample) | 21.1% | 25.3% |
| Standard Deviation (Population) | 20.9% | 24.9% |
Similar Demographics by Single Mother Poverty
Demographics Similar to Lumbee by Single Mother Poverty
In terms of single mother poverty, the demographic groups most similar to Lumbee are Tohono O'odham (43.0%, a difference of 0.49%), Houma (43.5%, a difference of 0.62%), Puerto Rican (44.5%, a difference of 3.0%), Cajun (40.3%, a difference of 7.2%), and Navajo (40.2%, a difference of 7.5%).
| Demographics | Rating | Rank | Single Mother Poverty |
| Menominee | 0.0 /100 | #333 | Tragic 37.1% |
| Pueblo | 0.0 /100 | #334 | Tragic 37.2% |
| Yuman | 0.0 /100 | #335 | Tragic 37.8% |
| Cheyenne | 0.0 /100 | #336 | Tragic 38.5% |
| Immigrants | Yemen | 0.0 /100 | #337 | Tragic 38.5% |
| Pima | 0.0 /100 | #338 | Tragic 38.6% |
| Crow | 0.0 /100 | #339 | Tragic 38.6% |
| Sioux | 0.0 /100 | #340 | Tragic 38.8% |
| Colville | 0.0 /100 | #341 | Tragic 39.3% |
| Navajo | 0.0 /100 | #342 | Tragic 40.2% |
| Cajuns | 0.0 /100 | #343 | Tragic 40.3% |
| Tohono O'odham | 0.0 /100 | #344 | Tragic 43.0% |
| Lumbee | 0.0 /100 | #345 | Tragic 43.2% |
| Houma | 0.0 /100 | #346 | Tragic 43.5% |
| Puerto Ricans | 0.0 /100 | #347 | Tragic 44.5% |
Demographics Similar to Paiute by Single Mother Poverty
In terms of single mother poverty, the demographic groups most similar to Paiute are Black/African American (35.2%, a difference of 0.20%), Iroquois (34.8%, a difference of 0.87%), Kiowa (35.5%, a difference of 0.91%), Chippewa (34.8%, a difference of 1.1%), and Ottawa (35.5%, a difference of 1.1%).
| Demographics | Rating | Rank | Single Mother Poverty |
| Chickasaw | 0.0 /100 | #314 | Tragic 34.4% |
| Hopi | 0.0 /100 | #315 | Tragic 34.5% |
| Dominicans | 0.0 /100 | #316 | Tragic 34.5% |
| Cherokee | 0.0 /100 | #317 | Tragic 34.5% |
| Immigrants | Honduras | 0.0 /100 | #318 | Tragic 34.7% |
| Chippewa | 0.0 /100 | #319 | Tragic 34.8% |
| Iroquois | 0.0 /100 | #320 | Tragic 34.8% |
| Paiute | 0.0 /100 | #321 | Tragic 35.1% |
| Blacks/African Americans | 0.0 /100 | #322 | Tragic 35.2% |
| Kiowa | 0.0 /100 | #323 | Tragic 35.5% |
| Ottawa | 0.0 /100 | #324 | Tragic 35.5% |
| Ute | 0.0 /100 | #325 | Tragic 35.7% |
| Seminole | 0.0 /100 | #326 | Tragic 35.8% |
| Yakama | 0.0 /100 | #327 | Tragic 36.4% |
| Choctaw | 0.0 /100 | #328 | Tragic 36.4% |