Basque vs Paiute Female Poverty
COMPARE
Basque
Paiute
Female Poverty
Female Poverty Comparison
Basques
Paiute
12.9%
FEMALE POVERTY
83.1/ 100
METRIC RATING
139th/ 347
METRIC RANK
17.7%
FEMALE POVERTY
0.0/ 100
METRIC RATING
323rd/ 347
METRIC RANK
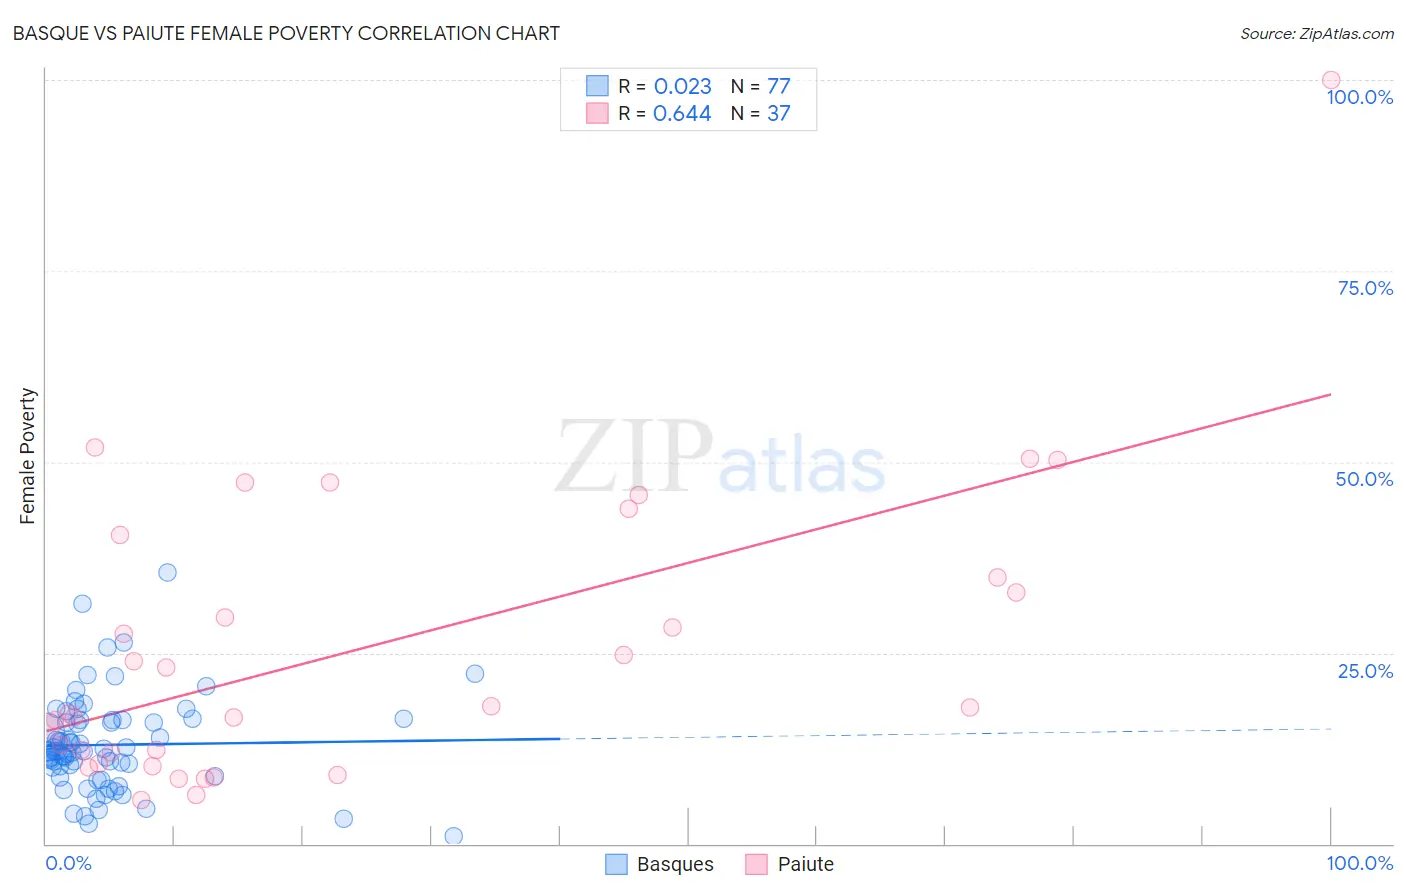
Basque vs Paiute Female Poverty Correlation Chart
The statistical analysis conducted on geographies consisting of 165,726,735 people shows no correlation between the proportion of Basques and poverty level among females in the United States with a correlation coefficient (R) of 0.023 and weighted average of 12.9%. Similarly, the statistical analysis conducted on geographies consisting of 58,391,472 people shows a significant positive correlation between the proportion of Paiute and poverty level among females in the United States with a correlation coefficient (R) of 0.644 and weighted average of 17.7%, a difference of 36.9%.
Female Poverty Correlation Summary
| Measurement | Basque | Paiute |
| Minimum | 1.1% | 5.7% |
| Maximum | 35.4% | 100.0% |
| Range | 34.4% | 94.3% |
| Mean | 12.9% | 25.6% |
| Median | 12.2% | 17.8% |
| Interquartile 25% (IQ1) | 9.4% | 11.2% |
| Interquartile 75% (IQ3) | 16.2% | 37.6% |
| Interquartile Range (IQR) | 6.7% | 26.4% |
| Standard Deviation (Sample) | 6.2% | 19.3% |
| Standard Deviation (Population) | 6.1% | 19.0% |
Similar Demographics by Female Poverty
Demographics Similar to Basques by Female Poverty
In terms of female poverty, the demographic groups most similar to Basques are Pakistani (12.9%, a difference of 0.010%), Immigrants from France (12.9%, a difference of 0.090%), Chilean (12.9%, a difference of 0.31%), Icelander (13.0%, a difference of 0.34%), and Peruvian (12.9%, a difference of 0.40%).
| Demographics | Rating | Rank | Female Poverty |
| Immigrants | Jordan | 86.9 /100 | #132 | Excellent 12.8% |
| Immigrants | Western Europe | 86.6 /100 | #133 | Excellent 12.8% |
| Immigrants | Switzerland | 85.8 /100 | #134 | Excellent 12.9% |
| French | 85.6 /100 | #135 | Excellent 12.9% |
| Peruvians | 85.2 /100 | #136 | Excellent 12.9% |
| Chileans | 84.7 /100 | #137 | Excellent 12.9% |
| Immigrants | France | 83.6 /100 | #138 | Excellent 12.9% |
| Basques | 83.1 /100 | #139 | Excellent 12.9% |
| Pakistanis | 83.0 /100 | #140 | Excellent 12.9% |
| Icelanders | 81.1 /100 | #141 | Excellent 13.0% |
| Brazilians | 80.5 /100 | #142 | Excellent 13.0% |
| Immigrants | Malaysia | 80.4 /100 | #143 | Excellent 13.0% |
| Afghans | 79.8 /100 | #144 | Good 13.0% |
| Syrians | 79.6 /100 | #145 | Good 13.0% |
| Immigrants | Peru | 79.1 /100 | #146 | Good 13.0% |
Demographics Similar to Paiute by Female Poverty
In terms of female poverty, the demographic groups most similar to Paiute are Immigrants from Honduras (17.7%, a difference of 0.18%), Colville (17.8%, a difference of 0.34%), Menominee (17.6%, a difference of 0.59%), Arapaho (17.5%, a difference of 1.3%), and Immigrants from Dominica (17.5%, a difference of 1.3%).
| Demographics | Rating | Rank | Female Poverty |
| Hondurans | 0.0 /100 | #316 | Tragic 17.4% |
| Immigrants | Congo | 0.0 /100 | #317 | Tragic 17.4% |
| Ute | 0.0 /100 | #318 | Tragic 17.5% |
| Cajuns | 0.0 /100 | #319 | Tragic 17.5% |
| Immigrants | Dominica | 0.0 /100 | #320 | Tragic 17.5% |
| Arapaho | 0.0 /100 | #321 | Tragic 17.5% |
| Menominee | 0.0 /100 | #322 | Tragic 17.6% |
| Paiute | 0.0 /100 | #323 | Tragic 17.7% |
| Immigrants | Honduras | 0.0 /100 | #324 | Tragic 17.7% |
| Colville | 0.0 /100 | #325 | Tragic 17.8% |
| Central American Indians | 0.0 /100 | #326 | Tragic 18.0% |
| Yakama | 0.0 /100 | #327 | Tragic 18.0% |
| Blacks/African Americans | 0.0 /100 | #328 | Tragic 18.6% |
| Kiowa | 0.0 /100 | #329 | Tragic 18.6% |
| Dominicans | 0.0 /100 | #330 | Tragic 19.1% |