Ugandan vs Paiute Female Poverty
COMPARE
Ugandan
Paiute
Female Poverty
Female Poverty Comparison
Ugandans
Paiute
14.0%
FEMALE POVERTY
15.4/ 100
METRIC RATING
205th/ 347
METRIC RANK
17.7%
FEMALE POVERTY
0.0/ 100
METRIC RATING
323rd/ 347
METRIC RANK
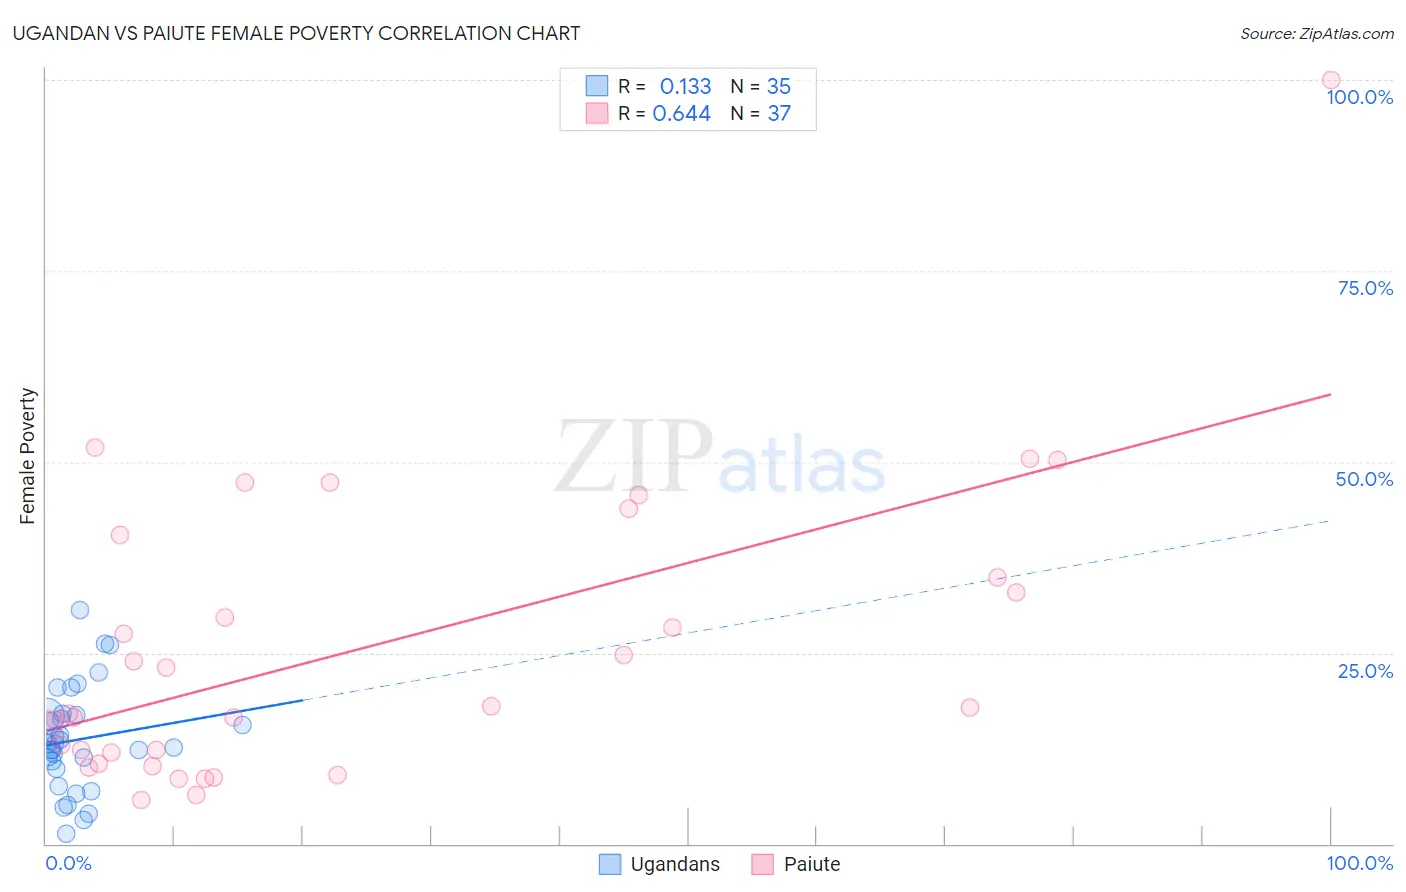
Ugandan vs Paiute Female Poverty Correlation Chart
The statistical analysis conducted on geographies consisting of 93,995,237 people shows a poor positive correlation between the proportion of Ugandans and poverty level among females in the United States with a correlation coefficient (R) of 0.133 and weighted average of 14.0%. Similarly, the statistical analysis conducted on geographies consisting of 58,391,472 people shows a significant positive correlation between the proportion of Paiute and poverty level among females in the United States with a correlation coefficient (R) of 0.644 and weighted average of 17.7%, a difference of 26.5%.
Female Poverty Correlation Summary
| Measurement | Ugandan | Paiute |
| Minimum | 1.3% | 5.7% |
| Maximum | 30.6% | 100.0% |
| Range | 29.3% | 94.3% |
| Mean | 13.6% | 25.6% |
| Median | 13.1% | 17.8% |
| Interquartile 25% (IQ1) | 9.8% | 11.2% |
| Interquartile 75% (IQ3) | 16.8% | 37.6% |
| Interquartile Range (IQR) | 7.0% | 26.4% |
| Standard Deviation (Sample) | 6.8% | 19.3% |
| Standard Deviation (Population) | 6.7% | 19.0% |
Similar Demographics by Female Poverty
Demographics Similar to Ugandans by Female Poverty
In terms of female poverty, the demographic groups most similar to Ugandans are Immigrants from Uruguay (14.0%, a difference of 0.27%), Spaniard (13.9%, a difference of 0.56%), Immigrants from Western Asia (13.9%, a difference of 0.84%), Hmong (13.9%, a difference of 0.89%), and Immigrants from Kenya (13.9%, a difference of 0.90%).
| Demographics | Rating | Rank | Female Poverty |
| Immigrants | Uganda | 28.5 /100 | #198 | Fair 13.7% |
| Immigrants | Lebanon | 25.6 /100 | #199 | Fair 13.8% |
| Spanish | 21.4 /100 | #200 | Fair 13.9% |
| Immigrants | Kenya | 21.1 /100 | #201 | Fair 13.9% |
| Hmong | 21.1 /100 | #202 | Fair 13.9% |
| Immigrants | Western Asia | 20.7 /100 | #203 | Fair 13.9% |
| Spaniards | 18.9 /100 | #204 | Poor 13.9% |
| Ugandans | 15.4 /100 | #205 | Poor 14.0% |
| Immigrants | Uruguay | 14.0 /100 | #206 | Poor 14.0% |
| Immigrants | Eastern Africa | 9.0 /100 | #207 | Tragic 14.2% |
| Immigrants | Azores | 7.9 /100 | #208 | Tragic 14.2% |
| Panamanians | 7.7 /100 | #209 | Tragic 14.2% |
| Malaysians | 7.4 /100 | #210 | Tragic 14.3% |
| Moroccans | 7.2 /100 | #211 | Tragic 14.3% |
| Bermudans | 5.5 /100 | #212 | Tragic 14.4% |
Demographics Similar to Paiute by Female Poverty
In terms of female poverty, the demographic groups most similar to Paiute are Immigrants from Honduras (17.7%, a difference of 0.18%), Colville (17.8%, a difference of 0.34%), Menominee (17.6%, a difference of 0.59%), Arapaho (17.5%, a difference of 1.3%), and Immigrants from Dominica (17.5%, a difference of 1.3%).
| Demographics | Rating | Rank | Female Poverty |
| Hondurans | 0.0 /100 | #316 | Tragic 17.4% |
| Immigrants | Congo | 0.0 /100 | #317 | Tragic 17.4% |
| Ute | 0.0 /100 | #318 | Tragic 17.5% |
| Cajuns | 0.0 /100 | #319 | Tragic 17.5% |
| Immigrants | Dominica | 0.0 /100 | #320 | Tragic 17.5% |
| Arapaho | 0.0 /100 | #321 | Tragic 17.5% |
| Menominee | 0.0 /100 | #322 | Tragic 17.6% |
| Paiute | 0.0 /100 | #323 | Tragic 17.7% |
| Immigrants | Honduras | 0.0 /100 | #324 | Tragic 17.7% |
| Colville | 0.0 /100 | #325 | Tragic 17.8% |
| Central American Indians | 0.0 /100 | #326 | Tragic 18.0% |
| Yakama | 0.0 /100 | #327 | Tragic 18.0% |
| Blacks/African Americans | 0.0 /100 | #328 | Tragic 18.6% |
| Kiowa | 0.0 /100 | #329 | Tragic 18.6% |
| Dominicans | 0.0 /100 | #330 | Tragic 19.1% |