Honduran vs Immigrants from Vietnam Female Poverty
COMPARE
Honduran
Immigrants from Vietnam
Female Poverty
Female Poverty Comparison
Hondurans
Immigrants from Vietnam
17.4%
FEMALE POVERTY
0.0/ 100
METRIC RATING
316th/ 347
METRIC RANK
12.8%
FEMALE POVERTY
87.1/ 100
METRIC RATING
130th/ 347
METRIC RANK
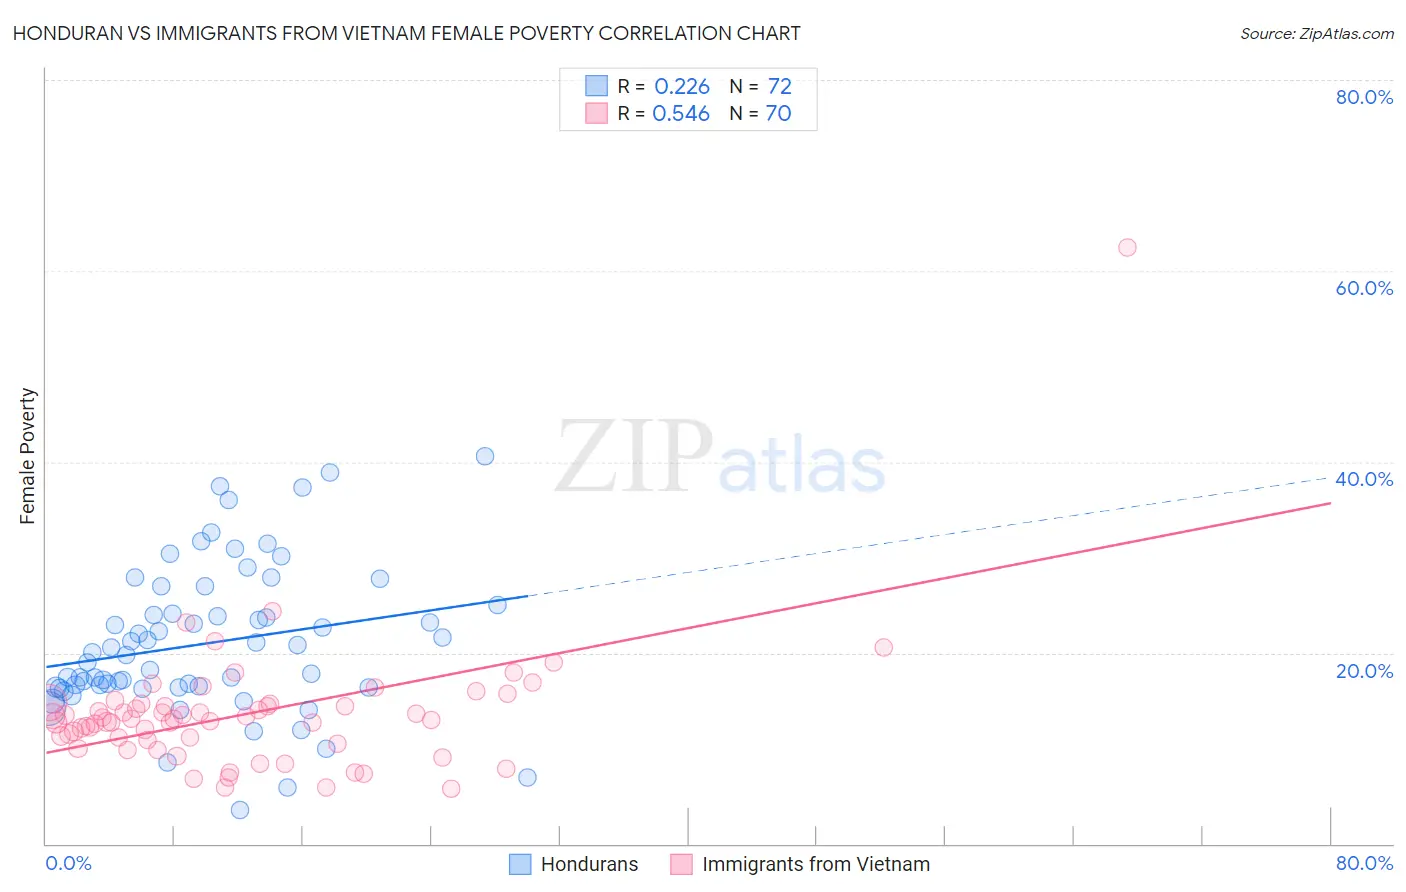
Honduran vs Immigrants from Vietnam Female Poverty Correlation Chart
The statistical analysis conducted on geographies consisting of 357,544,045 people shows a weak positive correlation between the proportion of Hondurans and poverty level among females in the United States with a correlation coefficient (R) of 0.226 and weighted average of 17.4%. Similarly, the statistical analysis conducted on geographies consisting of 404,524,088 people shows a substantial positive correlation between the proportion of Immigrants from Vietnam and poverty level among females in the United States with a correlation coefficient (R) of 0.546 and weighted average of 12.8%, a difference of 35.4%.
Female Poverty Correlation Summary
| Measurement | Honduran | Immigrants from Vietnam |
| Minimum | 3.6% | 5.8% |
| Maximum | 40.6% | 62.5% |
| Range | 37.0% | 56.7% |
| Mean | 21.0% | 13.6% |
| Median | 20.0% | 13.0% |
| Interquartile 25% (IQ1) | 16.4% | 10.8% |
| Interquartile 75% (IQ3) | 24.5% | 14.6% |
| Interquartile Range (IQR) | 8.1% | 3.8% |
| Standard Deviation (Sample) | 7.7% | 7.1% |
| Standard Deviation (Population) | 7.7% | 7.0% |
Similar Demographics by Female Poverty
Demographics Similar to Hondurans by Female Poverty
In terms of female poverty, the demographic groups most similar to Hondurans are Immigrants from Congo (17.4%, a difference of 0.19%), U.S. Virgin Islander (17.3%, a difference of 0.30%), Ute (17.5%, a difference of 0.52%), Cajun (17.5%, a difference of 0.53%), and Immigrants from Dominica (17.5%, a difference of 0.61%).
| Demographics | Rating | Rank | Female Poverty |
| Immigrants | Mexico | 0.0 /100 | #309 | Tragic 17.0% |
| Creek | 0.0 /100 | #310 | Tragic 17.0% |
| Immigrants | Guatemala | 0.0 /100 | #311 | Tragic 17.0% |
| Immigrants | Somalia | 0.0 /100 | #312 | Tragic 17.0% |
| British West Indians | 0.0 /100 | #313 | Tragic 17.0% |
| Dutch West Indians | 0.0 /100 | #314 | Tragic 17.1% |
| U.S. Virgin Islanders | 0.0 /100 | #315 | Tragic 17.3% |
| Hondurans | 0.0 /100 | #316 | Tragic 17.4% |
| Immigrants | Congo | 0.0 /100 | #317 | Tragic 17.4% |
| Ute | 0.0 /100 | #318 | Tragic 17.5% |
| Cajuns | 0.0 /100 | #319 | Tragic 17.5% |
| Immigrants | Dominica | 0.0 /100 | #320 | Tragic 17.5% |
| Arapaho | 0.0 /100 | #321 | Tragic 17.5% |
| Menominee | 0.0 /100 | #322 | Tragic 17.6% |
| Paiute | 0.0 /100 | #323 | Tragic 17.7% |
Demographics Similar to Immigrants from Vietnam by Female Poverty
In terms of female poverty, the demographic groups most similar to Immigrants from Vietnam are Immigrants from Argentina (12.8%, a difference of 0.030%), Immigrants from Jordan (12.8%, a difference of 0.050%), Immigrants from Western Europe (12.8%, a difference of 0.11%), Immigrants from Brazil (12.8%, a difference of 0.19%), and Immigrants from Belarus (12.8%, a difference of 0.27%).
| Demographics | Rating | Rank | Female Poverty |
| Immigrants | South Eastern Asia | 89.9 /100 | #123 | Excellent 12.7% |
| Immigrants | Norway | 89.3 /100 | #124 | Excellent 12.8% |
| Argentineans | 89.1 /100 | #125 | Excellent 12.8% |
| Immigrants | Ukraine | 88.8 /100 | #126 | Excellent 12.8% |
| South Africans | 88.4 /100 | #127 | Excellent 12.8% |
| Immigrants | Belarus | 88.2 /100 | #128 | Excellent 12.8% |
| Immigrants | Brazil | 87.9 /100 | #129 | Excellent 12.8% |
| Immigrants | Vietnam | 87.1 /100 | #130 | Excellent 12.8% |
| Immigrants | Argentina | 87.0 /100 | #131 | Excellent 12.8% |
| Immigrants | Jordan | 86.9 /100 | #132 | Excellent 12.8% |
| Immigrants | Western Europe | 86.6 /100 | #133 | Excellent 12.8% |
| Immigrants | Switzerland | 85.8 /100 | #134 | Excellent 12.9% |
| French | 85.6 /100 | #135 | Excellent 12.9% |
| Peruvians | 85.2 /100 | #136 | Excellent 12.9% |
| Chileans | 84.7 /100 | #137 | Excellent 12.9% |