Lumbee vs Immigrants from Vietnam 11th Grade
COMPARE
Lumbee
Immigrants from Vietnam
11th Grade
11th Grade Comparison
Lumbee
Immigrants from Vietnam
88.9%
11TH GRADE
0.0/ 100
METRIC RATING
317th/ 347
METRIC RANK
90.0%
11TH GRADE
0.0/ 100
METRIC RATING
295th/ 347
METRIC RANK
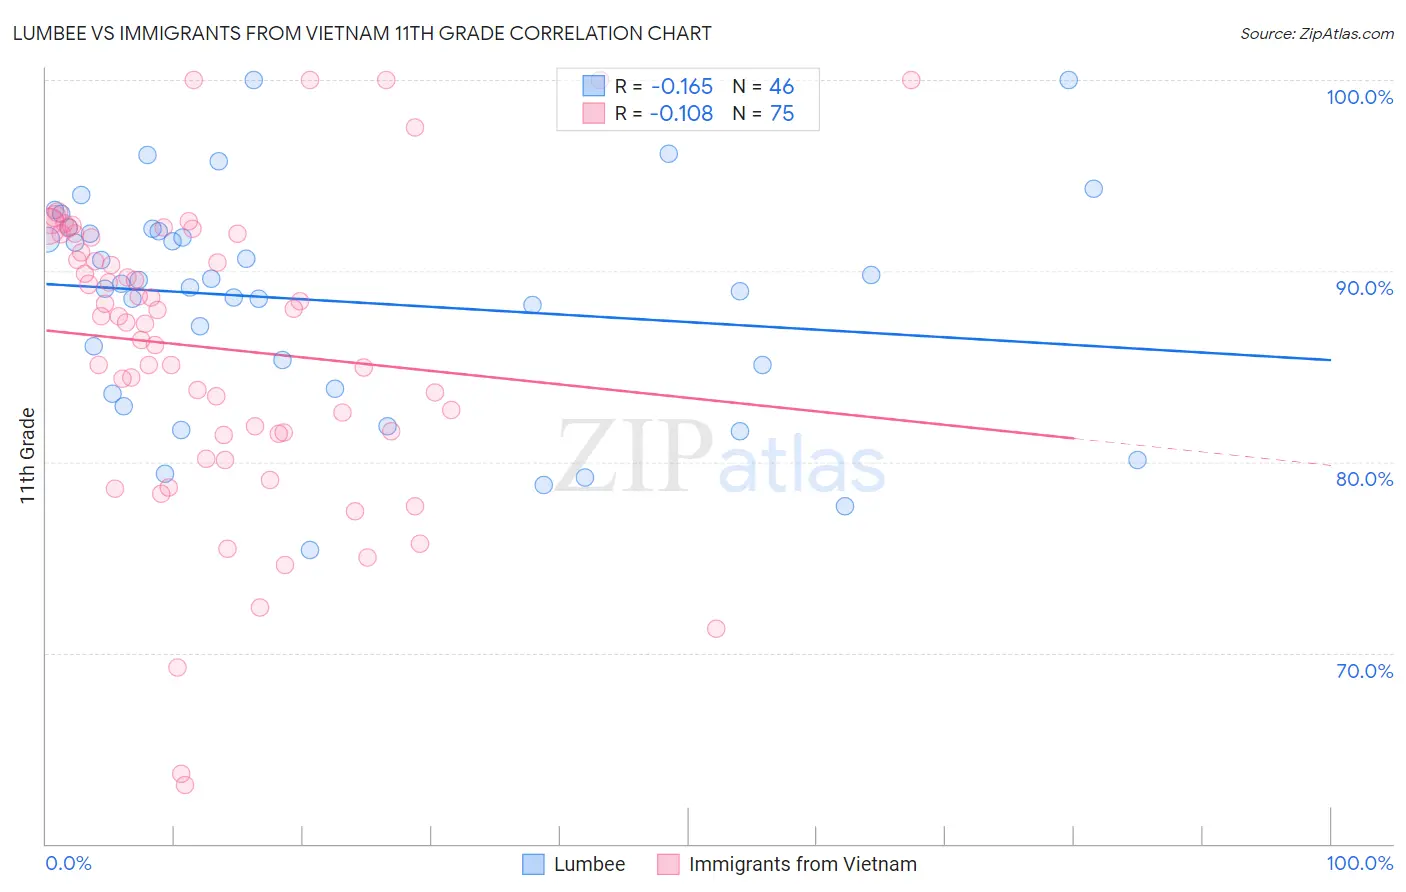
Lumbee vs Immigrants from Vietnam 11th Grade Correlation Chart
The statistical analysis conducted on geographies consisting of 92,299,068 people shows a poor negative correlation between the proportion of Lumbee and percentage of population with at least 11th grade education in the United States with a correlation coefficient (R) of -0.165 and weighted average of 88.9%. Similarly, the statistical analysis conducted on geographies consisting of 404,843,921 people shows a poor negative correlation between the proportion of Immigrants from Vietnam and percentage of population with at least 11th grade education in the United States with a correlation coefficient (R) of -0.108 and weighted average of 90.0%, a difference of 1.3%.
11th Grade Correlation Summary
| Measurement | Lumbee | Immigrants from Vietnam |
| Minimum | 75.4% | 63.1% |
| Maximum | 100.0% | 100.0% |
| Range | 24.6% | 36.9% |
| Mean | 88.4% | 85.9% |
| Median | 89.2% | 87.6% |
| Interquartile 25% (IQ1) | 83.9% | 81.5% |
| Interquartile 75% (IQ3) | 92.1% | 91.9% |
| Interquartile Range (IQR) | 8.2% | 10.4% |
| Standard Deviation (Sample) | 5.8% | 7.9% |
| Standard Deviation (Population) | 5.7% | 7.9% |
Similar Demographics by 11th Grade
Demographics Similar to Lumbee by 11th Grade
In terms of 11th grade, the demographic groups most similar to Lumbee are Immigrants from Cuba (88.9%, a difference of 0.010%), Nicaraguan (88.9%, a difference of 0.060%), Belizean (88.8%, a difference of 0.15%), Immigrants from Ecuador (89.1%, a difference of 0.16%), and Cape Verdean (89.1%, a difference of 0.17%).
| Demographics | Rating | Rank | 11th Grade |
| Yaqui | 0.0 /100 | #310 | Tragic 89.5% |
| Vietnamese | 0.0 /100 | #311 | Tragic 89.4% |
| Immigrants | Portugal | 0.0 /100 | #312 | Tragic 89.3% |
| Immigrants | Caribbean | 0.0 /100 | #313 | Tragic 89.1% |
| Cape Verdeans | 0.0 /100 | #314 | Tragic 89.1% |
| Immigrants | Ecuador | 0.0 /100 | #315 | Tragic 89.1% |
| Immigrants | Cuba | 0.0 /100 | #316 | Tragic 88.9% |
| Lumbee | 0.0 /100 | #317 | Tragic 88.9% |
| Nicaraguans | 0.0 /100 | #318 | Tragic 88.9% |
| Belizeans | 0.0 /100 | #319 | Tragic 88.8% |
| Immigrants | Armenia | 0.0 /100 | #320 | Tragic 88.8% |
| Immigrants | Belize | 0.0 /100 | #321 | Tragic 88.7% |
| Puerto Ricans | 0.0 /100 | #322 | Tragic 88.4% |
| Pima | 0.0 /100 | #323 | Tragic 88.3% |
| Central American Indians | 0.0 /100 | #324 | Tragic 88.2% |
Demographics Similar to Immigrants from Vietnam by 11th Grade
In terms of 11th grade, the demographic groups most similar to Immigrants from Vietnam are Fijian (90.0%, a difference of 0.020%), Navajo (90.0%, a difference of 0.060%), Immigrants from Grenada (90.1%, a difference of 0.11%), Immigrants from Fiji (89.9%, a difference of 0.13%), and Native/Alaskan (90.2%, a difference of 0.15%).
| Demographics | Rating | Rank | 11th Grade |
| Pennsylvania Germans | 0.0 /100 | #288 | Tragic 90.3% |
| British West Indians | 0.0 /100 | #289 | Tragic 90.3% |
| Indonesians | 0.0 /100 | #290 | Tragic 90.3% |
| Haitians | 0.0 /100 | #291 | Tragic 90.3% |
| Cubans | 0.0 /100 | #292 | Tragic 90.2% |
| Natives/Alaskans | 0.0 /100 | #293 | Tragic 90.2% |
| Immigrants | Grenada | 0.0 /100 | #294 | Tragic 90.1% |
| Immigrants | Vietnam | 0.0 /100 | #295 | Tragic 90.0% |
| Fijians | 0.0 /100 | #296 | Tragic 90.0% |
| Navajo | 0.0 /100 | #297 | Tragic 90.0% |
| Immigrants | Fiji | 0.0 /100 | #298 | Tragic 89.9% |
| Japanese | 0.0 /100 | #299 | Tragic 89.9% |
| Immigrants | Haiti | 0.0 /100 | #300 | Tragic 89.9% |
| Guyanese | 0.0 /100 | #301 | Tragic 89.9% |
| Immigrants | Guyana | 0.0 /100 | #302 | Tragic 89.7% |