Lumbee vs Immigrants from Vietnam Median Male Earnings
COMPARE
Lumbee
Immigrants from Vietnam
Median Male Earnings
Median Male Earnings Comparison
Lumbee
Immigrants from Vietnam
$41,715
MEDIAN MALE EARNINGS
0.0/ 100
METRIC RATING
343rd/ 347
METRIC RANK
$54,913
MEDIAN MALE EARNINGS
60.2/ 100
METRIC RATING
168th/ 347
METRIC RANK
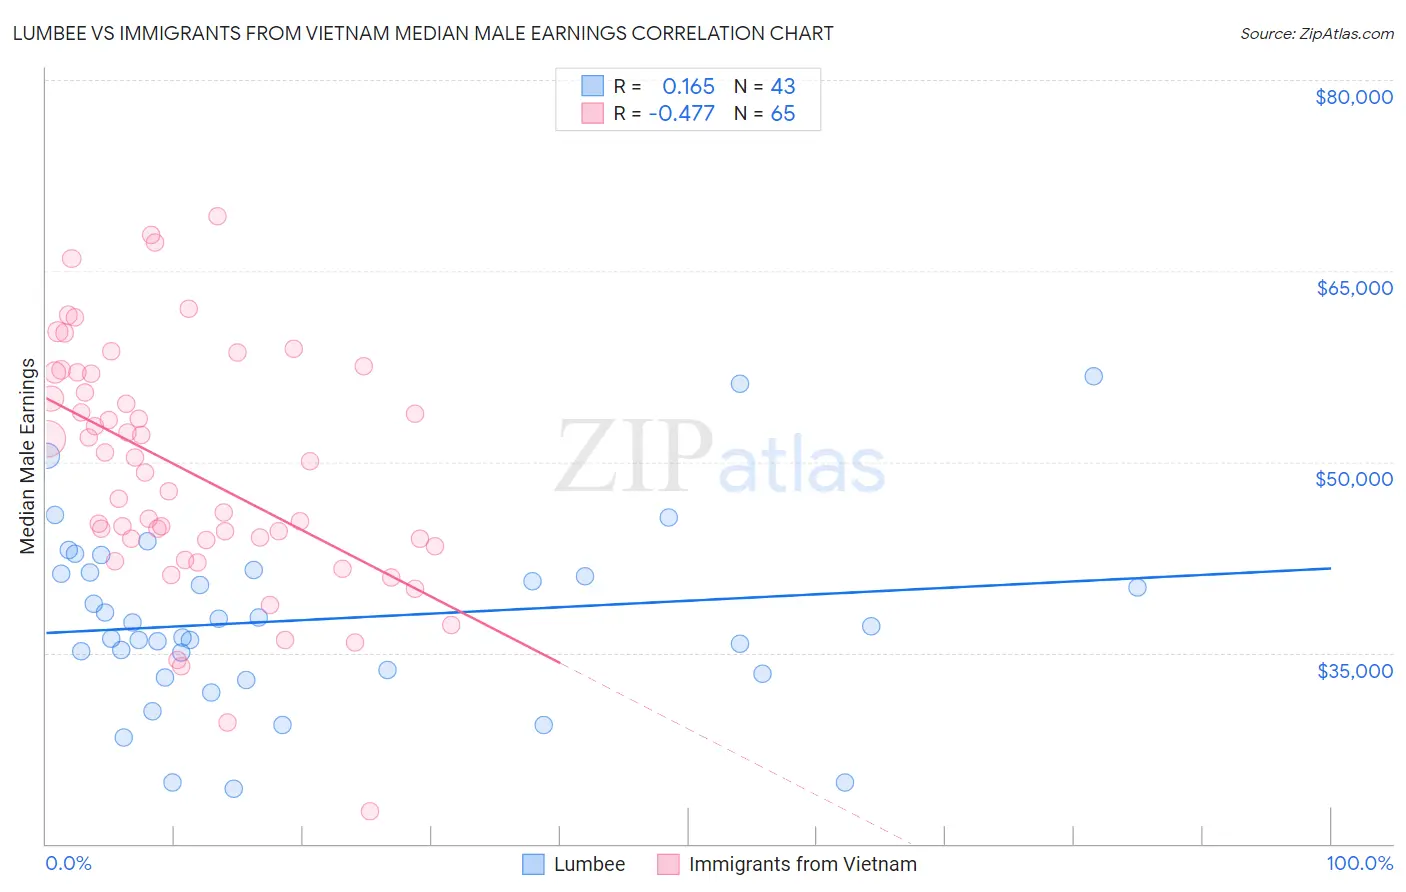
Lumbee vs Immigrants from Vietnam Median Male Earnings Correlation Chart
The statistical analysis conducted on geographies consisting of 92,276,202 people shows a poor positive correlation between the proportion of Lumbee and median male earnings in the United States with a correlation coefficient (R) of 0.165 and weighted average of $41,715. Similarly, the statistical analysis conducted on geographies consisting of 404,603,118 people shows a moderate negative correlation between the proportion of Immigrants from Vietnam and median male earnings in the United States with a correlation coefficient (R) of -0.477 and weighted average of $54,913, a difference of 31.6%.
Median Male Earnings Correlation Summary
| Measurement | Lumbee | Immigrants from Vietnam |
| Minimum | $24,297 | $22,532 |
| Maximum | $56,719 | $69,274 |
| Range | $32,422 | $46,742 |
| Mean | $37,623 | $49,248 |
| Median | $37,072 | $49,189 |
| Interquartile 25% (IQ1) | $33,323 | $43,623 |
| Interquartile 75% (IQ3) | $41,323 | $56,949 |
| Interquartile Range (IQR) | $8,000 | $13,326 |
| Standard Deviation (Sample) | $7,117 | $9,503 |
| Standard Deviation (Population) | $7,034 | $9,429 |
Similar Demographics by Median Male Earnings
Demographics Similar to Lumbee by Median Male Earnings
In terms of median male earnings, the demographic groups most similar to Lumbee are Arapaho ($41,758, a difference of 0.10%), Hopi ($42,060, a difference of 0.83%), Navajo ($42,098, a difference of 0.92%), Pueblo ($41,314, a difference of 0.97%), and Pima ($42,357, a difference of 1.5%).
| Demographics | Rating | Rank | Median Male Earnings |
| Immigrants | Congo | 0.0 /100 | #333 | Tragic $44,204 |
| Immigrants | Yemen | 0.0 /100 | #334 | Tragic $44,083 |
| Spanish American Indians | 0.0 /100 | #335 | Tragic $44,010 |
| Immigrants | Cuba | 0.0 /100 | #336 | Tragic $43,461 |
| Menominee | 0.0 /100 | #337 | Tragic $42,581 |
| Crow | 0.0 /100 | #338 | Tragic $42,434 |
| Pima | 0.0 /100 | #339 | Tragic $42,357 |
| Navajo | 0.0 /100 | #340 | Tragic $42,098 |
| Hopi | 0.0 /100 | #341 | Tragic $42,060 |
| Arapaho | 0.0 /100 | #342 | Tragic $41,758 |
| Lumbee | 0.0 /100 | #343 | Tragic $41,715 |
| Pueblo | 0.0 /100 | #344 | Tragic $41,314 |
| Puerto Ricans | 0.0 /100 | #345 | Tragic $40,071 |
| Tohono O'odham | 0.0 /100 | #346 | Tragic $39,543 |
| Yup'ik | 0.0 /100 | #347 | Tragic $39,504 |
Demographics Similar to Immigrants from Vietnam by Median Male Earnings
In terms of median male earnings, the demographic groups most similar to Immigrants from Vietnam are Immigrants from Fiji ($54,958, a difference of 0.080%), German ($54,974, a difference of 0.11%), French Canadian ($54,722, a difference of 0.35%), Finnish ($54,721, a difference of 0.35%), and Immigrants from Peru ($54,695, a difference of 0.40%).
| Demographics | Rating | Rank | Median Male Earnings |
| Belgians | 70.1 /100 | #161 | Good $55,361 |
| French | 69.9 /100 | #162 | Good $55,350 |
| Ugandans | 68.6 /100 | #163 | Good $55,290 |
| Immigrants | South Eastern Asia | 67.6 /100 | #164 | Good $55,241 |
| Immigrants | Portugal | 66.3 /100 | #165 | Good $55,182 |
| Germans | 61.6 /100 | #166 | Good $54,974 |
| Immigrants | Fiji | 61.2 /100 | #167 | Good $54,958 |
| Immigrants | Vietnam | 60.2 /100 | #168 | Good $54,913 |
| French Canadians | 55.6 /100 | #169 | Average $54,722 |
| Finns | 55.6 /100 | #170 | Average $54,721 |
| Immigrants | Peru | 54.9 /100 | #171 | Average $54,695 |
| Welsh | 53.8 /100 | #172 | Average $54,647 |
| South American Indians | 50.4 /100 | #173 | Average $54,508 |
| South Americans | 50.0 /100 | #174 | Average $54,492 |
| Dutch | 48.0 /100 | #175 | Average $54,410 |