Scandinavian vs Immigrants from Nigeria Female Poverty

COMPARE

Scandinavian
Race
Ancestry
AfghanAfricanAlaska NativeAlaskan AthabascanAlbanianAleutAlsatianAmericanApacheArabArapahoArgentineanArmenianAssyrian/Chaldean/SyriacAustralianAustrianBahamianBangladeshiBarbadianBasqueBelgianBelizeanBermudanBhutaneseBlackfeetBolivianBrazilianBritishBritish West IndianBulgarianBurmeseCajunCambodianCanadianCape VerdeanCarpatho RusynCelticCentral AmericanCentral American IndianCherokeeCheyenneChickasawChileanChineseChippewaChoctawColombianColvilleComancheCosta RicanCreeCreekCroatianCrowCubanCypriotCzechCzechoslovakianDanishDelawareDominicanDutchDutch West IndianEastern EuropeanEcuadorianEgyptianEnglishEstonianEthiopianEuropeanFijianFilipinoFinnishFrenchFrench American IndianFrench CanadianGermanGerman RussianGhanaianGreekGuamanian/ChamorroGuatemalanGuyaneseHaitianHmongHonduranHopiHoumaHungarianIcelanderIndian (Asian)IndonesianInupiatIranianIraqiIrishIroquoisIsraeliItalianJamaicanJapaneseJordanianKenyanKiowaKoreanLaotianLatvianLebaneseLiberianLithuanianLumbeeLuxembourgerMacedonianMalaysianMalteseMarshalleseMenomineeMexicanMexican American IndianMongolianMoroccanNative HawaiianNavajoNepaleseNew ZealanderNicaraguanNigerianNorthern EuropeanNorwegianOkinawanOsageOttawaPaiutePakistaniPalestinianPanamanianParaguayanPennsylvania GermanPeruvianPimaPolishPortuguesePotawatomiPuebloPuerto RicanPuget Sound SalishRomanianRussianSalvadoranSamoanScandinavianScotch-IrishScottishSeminoleSenegaleseSerbianShoshoneSierra LeoneanSiouxSlavicSlovakSloveneSomaliSouth AfricanSouth AmericanSouth American IndianSoviet UnionSpaniardSpanishSpanish AmericanSpanish American IndianSri LankanSubsaharan AfricanSudaneseSwedishSwissSyrianTaiwaneseThaiTlingit-HaidaTohono O'OdhamTonganTrinidadian and TobagonianTsimshianTurkishU.S. Virgin IslanderUgandanUkrainianUruguayanUteVenezuelanVietnameseWelshWest IndianYakamaYaquiYugoslavianYumanYup'ikZimbabwean
Immigration
NonimmigrantsImmigrantsAfghanistanAfricaAlbaniaArgentinaArmeniaAsiaAustraliaAustriaBahamasBangladeshBarbadosBelarusBelgiumBelizeBoliviaBosnia and HerzegovinaBrazilBulgariaBurma/MyanmarCabo VerdeCambodiaCameroonCanadaCaribbeanCentral AmericaChileChinaColombiaCongoCosta RicaCroatiaCubaCzechoslovakiaDenmarkDominicaDominican RepublicEastern AfricaEastern AsiaEastern EuropeEcuadorEgyptEl SalvadorEnglandEritreaEthiopiaEuropeFijiFranceGermanyGhanaGreeceGrenadaGuatemalaGuyanaHaitiHondurasHong KongHungaryIndiaIndonesiaIranIraqIrelandIsraelItalyJamaicaJapanJordanKazakhstanKenyaKoreaKuwaitLaosLatin AmericaLatviaLebanonLiberiaLithuaniaMalaysiaMexicoMicronesiaMiddle AfricaMoldovaMoroccoNepalNetherlandsNicaraguaNorth AmericaNorth MacedoniaNorthern AfricaNorthern EuropeNorwayOceaniaPakistanPanamaPeruPhilippinesPolandPortugalRomaniaRussiaSaudi ArabiaScotlandSenegalSerbiaSierra LeoneSingaporeSomaliaSouth AfricaSouth AmericaSouth Central AsiaSouth Eastern AsiaSouthern EuropeSpainSri LankaSt. Vincent and the GrenadinesSudanSwedenSwitzerlandSyriaTaiwanThailandTrinidad and TobagoTurkeyUgandaUkraineUruguayUzbekistanVenezuelaVietnamWest IndiesWestern AfricaWestern AsiaWestern EuropeYemenZaireZimbabweAzores
Immigrants from Nigeria
Race
Ancestry
AfghanAfricanAlaska NativeAlaskan AthabascanAlbanianAleutAlsatianAmericanApacheArabArapahoArgentineanArmenianAssyrian/Chaldean/SyriacAustralianAustrianBahamianBangladeshiBarbadianBasqueBelgianBelizeanBermudanBhutaneseBlackfeetBolivianBrazilianBritishBritish West IndianBulgarianBurmeseCajunCambodianCanadianCape VerdeanCarpatho RusynCelticCentral AmericanCentral American IndianCherokeeCheyenneChickasawChileanChineseChippewaChoctawColombianColvilleComancheCosta RicanCreeCreekCroatianCrowCubanCypriotCzechCzechoslovakianDanishDelawareDominicanDutchDutch West IndianEastern EuropeanEcuadorianEgyptianEnglishEstonianEthiopianEuropeanFijianFilipinoFinnishFrenchFrench American IndianFrench CanadianGermanGerman RussianGhanaianGreekGuamanian/ChamorroGuatemalanGuyaneseHaitianHmongHonduranHopiHoumaHungarianIcelanderIndian (Asian)IndonesianInupiatIranianIraqiIrishIroquoisIsraeliItalianJamaicanJapaneseJordanianKenyanKiowaKoreanLaotianLatvianLebaneseLiberianLithuanianLumbeeLuxembourgerMacedonianMalaysianMalteseMarshalleseMenomineeMexicanMexican American IndianMongolianMoroccanNative HawaiianNavajoNepaleseNew ZealanderNicaraguanNigerianNorthern EuropeanNorwegianOkinawanOsageOttawaPaiutePakistaniPalestinianPanamanianParaguayanPennsylvania GermanPeruvianPimaPolishPortuguesePotawatomiPuebloPuerto RicanPuget Sound SalishRomanianRussianSalvadoranSamoanScotch-IrishScottishSeminoleSenegaleseSerbianShoshoneSierra LeoneanSiouxSlavicSlovakSloveneSomaliSouth AfricanSouth AmericanSouth American IndianSoviet UnionSpaniardSpanishSpanish AmericanSpanish American IndianSri LankanSubsaharan AfricanSudaneseSwedishSwissSyrianTaiwaneseThaiTlingit-HaidaTohono O'OdhamTonganTrinidadian and TobagonianTsimshianTurkishU.S. Virgin IslanderUgandanUkrainianUruguayanUteVenezuelanVietnameseWelshWest IndianYakamaYaquiYugoslavianYumanYup'ikZimbabwean
Immigration
NonimmigrantsImmigrantsAfghanistanAfricaAlbaniaArgentinaArmeniaAsiaAustraliaAustriaBahamasBangladeshBarbadosBelarusBelgiumBelizeBoliviaBosnia and HerzegovinaBrazilBulgariaBurma/MyanmarCabo VerdeCambodiaCameroonCanadaCaribbeanCentral AmericaChileChinaColombiaCongoCosta RicaCroatiaCubaCzechoslovakiaDenmarkDominicaDominican RepublicEastern AfricaEastern AsiaEastern EuropeEcuadorEgyptEl SalvadorEnglandEritreaEthiopiaEuropeFijiFranceGermanyGhanaGreeceGrenadaGuatemalaGuyanaHaitiHondurasHong KongHungaryIndiaIndonesiaIranIraqIrelandIsraelItalyJamaicaJapanJordanKazakhstanKenyaKoreaKuwaitLaosLatin AmericaLatviaLebanonLiberiaLithuaniaMalaysiaMexicoMicronesiaMiddle AfricaMoldovaMoroccoNepalNetherlandsNicaraguaNigeriaNorth AmericaNorth MacedoniaNorthern AfricaNorthern EuropeNorwayOceaniaPakistanPanamaPeruPhilippinesPolandPortugalRomaniaRussiaSaudi ArabiaScotlandSenegalSerbiaSierra LeoneSingaporeSomaliaSouth AfricaSouth AmericaSouth Central AsiaSouth Eastern AsiaSouthern EuropeSpainSri LankaSt. Vincent and the GrenadinesSudanSwedenSwitzerlandSyriaTaiwanThailandTrinidad and TobagoTurkeyUgandaUkraineUruguayUzbekistanVenezuelaVietnamWest IndiesWestern AfricaWestern AsiaWestern EuropeYemenZaireZimbabweAzores
Female Poverty
Income
Poverty
Unemployment
Labor Participation
Family Structure
Vehicle Availability
Education Level
Disability

Female Poverty Comparison

Scandinavians

Immigrants from Nigeria

Exceptional
Tragic
12.1%
FEMALE POVERTY
98.2/ 100
METRIC RATING
58th/ 347
METRIC RANK
14.7%
FEMALE POVERTY
2.1/ 100
METRIC RATING
227th/ 347
METRIC RANK

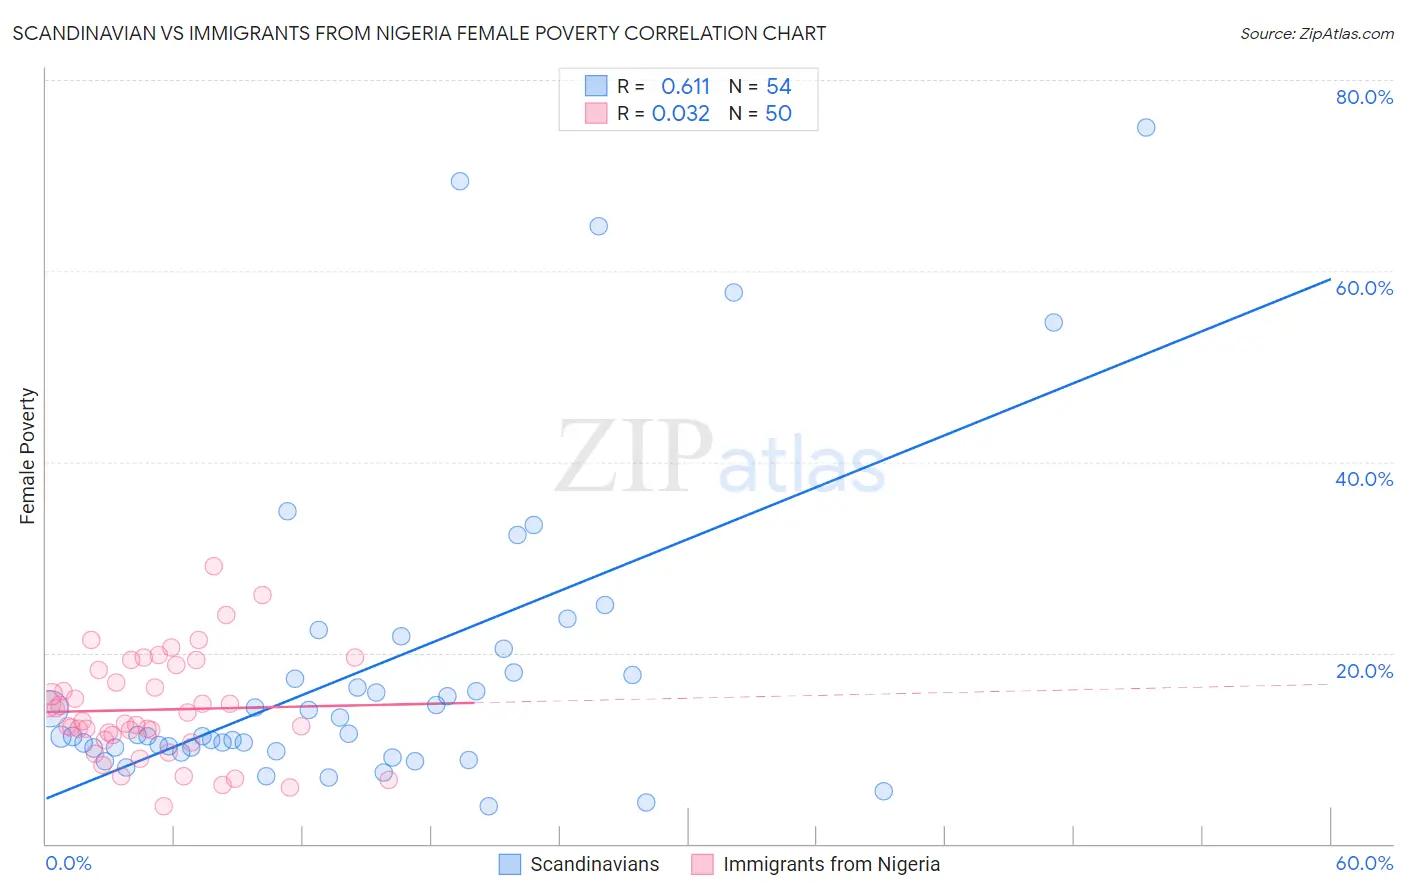
Scandinavian vs Immigrants from Nigeria Female Poverty Correlation Chart

The statistical analysis conducted on geographies consisting of 472,075,178 people shows a significant positive correlation between the proportion of Scandinavians and poverty level among females in the United States with a correlation coefficient (R) of 0.611 and weighted average of 12.1%. Similarly, the statistical analysis conducted on geographies consisting of 283,264,818 people shows no correlation between the proportion of Immigrants from Nigeria and poverty level among females in the United States with a correlation coefficient (R) of 0.032 and weighted average of 14.7%, a difference of 20.9%.
Scandinavian vs Immigrants from Nigeria Female Poverty

Female Poverty Correlation Summary

MeasurementScandinavianImmigrants from Nigeria
Minimum3.9%3.9%
Maximum75.0%29.1%
Range71.1%25.2%
Mean18.4%14.0%
Median11.3%12.7%
Interquartile 25% (IQ1)10.0%10.8%
Interquartile 75% (IQ3)18.0%18.2%
Interquartile Range (IQR)7.9%7.4%
Standard Deviation (Sample)16.4%5.4%
Standard Deviation (Population)16.2%5.4%

Similar Demographics by Female Poverty

Demographics Similar to Scandinavians by Female Poverty

In terms of female poverty, the demographic groups most similar to Scandinavians are Immigrants from Europe (12.1%, a difference of 0.010%), Immigrants from Serbia (12.1%, a difference of 0.080%), Estonian (12.1%, a difference of 0.14%), Immigrants from Australia (12.2%, a difference of 0.25%), and Immigrants from Asia (12.2%, a difference of 0.26%).
DemographicsRating | RankFemale Poverty
Immigrants | Bulgaria
98.9
/100
|
#51
Exceptional
12.0%
Immigrants | Croatia
98.7
/100
|
#52
Exceptional
12.0%
Immigrants | Austria
98.7
/100
|
#53
Exceptional
12.0%
Immigrants | Philippines
98.7
/100
|
#54
Exceptional
12.1%
Immigrants | Sri Lanka
98.5
/100
|
#55
Exceptional
12.1%
Estonians
98.3
/100
|
#56
Exceptional
12.1%
Immigrants | Serbia
98.3
/100
|
#57
Exceptional
12.1%
Scandinavians
98.2
/100
|
#58
Exceptional
12.1%
Immigrants | Europe
98.2
/100
|
#59
Exceptional
12.1%
Immigrants | Australia
98.1
/100
|
#60
Exceptional
12.2%
Immigrants | Asia
98.1
/100
|
#61
Exceptional
12.2%
Immigrants | Italy
98.0
/100
|
#62
Exceptional
12.2%
Ukrainians
98.0
/100
|
#63
Exceptional
12.2%
Germans
98.0
/100
|
#64
Exceptional
12.2%
Indians (Asian)
97.9
/100
|
#65
Exceptional
12.2%

Demographics Similar to Immigrants from Nigeria by Female Poverty

In terms of female poverty, the demographic groups most similar to Immigrants from Nigeria are German Russian (14.7%, a difference of 0.15%), Ghanaian (14.7%, a difference of 0.21%), Immigrants from Eritrea (14.6%, a difference of 0.31%), Alaska Native (14.7%, a difference of 0.41%), and Nigerian (14.8%, a difference of 0.51%).
DemographicsRating | RankFemale Poverty
Alsatians
4.0
/100
|
#220
Tragic
14.5%
Immigrants | Cambodia
3.7
/100
|
#221
Tragic
14.5%
Immigrants | Nonimmigrants
3.7
/100
|
#222
Tragic
14.5%
Immigrants | Africa
3.3
/100
|
#223
Tragic
14.5%
Americans
2.8
/100
|
#224
Tragic
14.6%
Immigrants | Micronesia
2.8
/100
|
#225
Tragic
14.6%
Immigrants | Eritrea
2.4
/100
|
#226
Tragic
14.6%
Immigrants | Nigeria
2.1
/100
|
#227
Tragic
14.7%
German Russians
2.0
/100
|
#228
Tragic
14.7%
Ghanaians
1.9
/100
|
#229
Tragic
14.7%
Alaska Natives
1.8
/100
|
#230
Tragic
14.7%
Nigerians
1.7
/100
|
#231
Tragic
14.8%
Osage
1.5
/100
|
#232
Tragic
14.8%
Immigrants | Saudi Arabia
1.4
/100
|
#233
Tragic
14.8%
Fijians
1.1
/100
|
#234
Tragic
14.9%