Lumbee vs Immigrants from Nigeria Seniors Poverty Over the Age of 75
COMPARE
Lumbee
Immigrants from Nigeria
Seniors Poverty Over the Age of 75
Seniors Poverty Over the Age of 75 Comparison
Lumbee
Immigrants from Nigeria
19.7%
SENIORS POVERTY OVER THE AGE OF 75
0.0/ 100
METRIC RATING
343rd/ 347
METRIC RANK
13.0%
SENIORS POVERTY OVER THE AGE OF 75
3.3/ 100
METRIC RATING
223rd/ 347
METRIC RANK
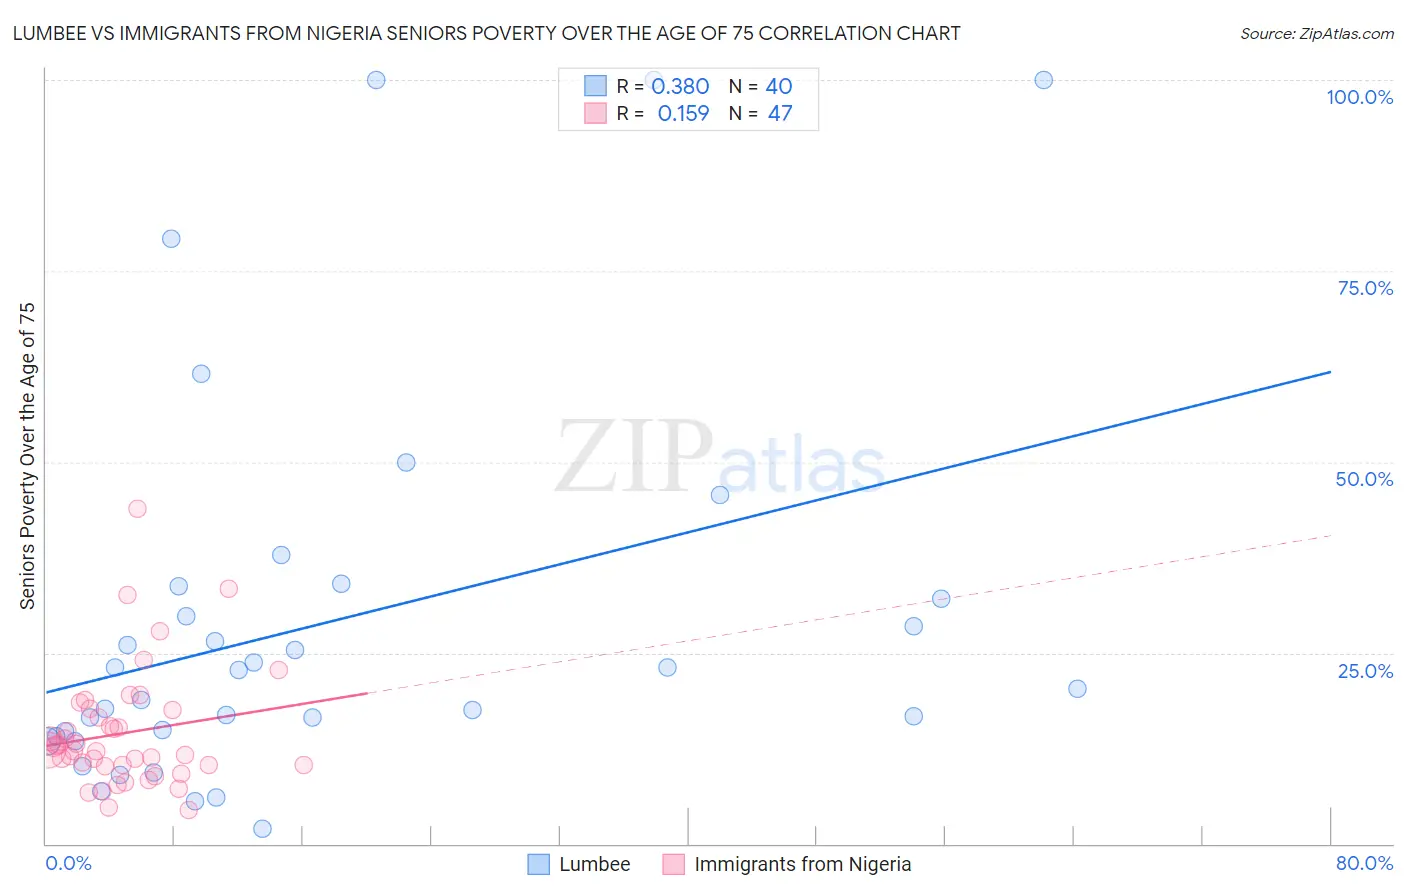
Lumbee vs Immigrants from Nigeria Seniors Poverty Over the Age of 75 Correlation Chart
The statistical analysis conducted on geographies consisting of 91,707,280 people shows a mild positive correlation between the proportion of Lumbee and poverty level among seniors over the age of 75 in the United States with a correlation coefficient (R) of 0.380 and weighted average of 19.7%. Similarly, the statistical analysis conducted on geographies consisting of 281,265,931 people shows a poor positive correlation between the proportion of Immigrants from Nigeria and poverty level among seniors over the age of 75 in the United States with a correlation coefficient (R) of 0.159 and weighted average of 13.0%, a difference of 51.5%.
Seniors Poverty Over the Age of 75 Correlation Summary
| Measurement | Lumbee | Immigrants from Nigeria |
| Minimum | 2.0% | 4.3% |
| Maximum | 100.0% | 43.8% |
| Range | 98.0% | 39.5% |
| Mean | 29.1% | 14.5% |
| Median | 21.5% | 12.2% |
| Interquartile 25% (IQ1) | 14.4% | 10.2% |
| Interquartile 75% (IQ3) | 32.9% | 17.5% |
| Interquartile Range (IQR) | 18.5% | 7.3% |
| Standard Deviation (Sample) | 25.5% | 7.7% |
| Standard Deviation (Population) | 25.2% | 7.6% |
Similar Demographics by Seniors Poverty Over the Age of 75
Demographics Similar to Lumbee by Seniors Poverty Over the Age of 75
In terms of seniors poverty over the age of 75, the demographic groups most similar to Lumbee are Dominican (19.6%, a difference of 0.66%), Immigrants from Cuba (19.9%, a difference of 0.79%), Immigrants from Dominican Republic (20.1%, a difference of 1.6%), Navajo (19.4%, a difference of 1.9%), and Tohono O'odham (19.1%, a difference of 3.2%).
| Demographics | Rating | Rank | Seniors Poverty Over the Age of 75 |
| Immigrants | Nicaragua | 0.0 /100 | #333 | Tragic 17.6% |
| Immigrants | Grenada | 0.0 /100 | #334 | Tragic 17.8% |
| Cubans | 0.0 /100 | #335 | Tragic 18.0% |
| Immigrants | Caribbean | 0.0 /100 | #336 | Tragic 18.2% |
| Yakama | 0.0 /100 | #337 | Tragic 18.3% |
| Immigrants | Cabo Verde | 0.0 /100 | #338 | Tragic 18.5% |
| Hopi | 0.0 /100 | #339 | Tragic 18.9% |
| Tohono O'odham | 0.0 /100 | #340 | Tragic 19.1% |
| Navajo | 0.0 /100 | #341 | Tragic 19.4% |
| Dominicans | 0.0 /100 | #342 | Tragic 19.6% |
| Lumbee | 0.0 /100 | #343 | Tragic 19.7% |
| Immigrants | Cuba | 0.0 /100 | #344 | Tragic 19.9% |
| Immigrants | Dominican Republic | 0.0 /100 | #345 | Tragic 20.1% |
| Puerto Ricans | 0.0 /100 | #346 | Tragic 23.2% |
| Pima | 0.0 /100 | #347 | Tragic 23.9% |
Demographics Similar to Immigrants from Nigeria by Seniors Poverty Over the Age of 75
In terms of seniors poverty over the age of 75, the demographic groups most similar to Immigrants from Nigeria are Nigerian (13.0%, a difference of 0.090%), Chippewa (13.1%, a difference of 0.20%), Immigrants from Morocco (13.1%, a difference of 0.27%), Shoshone (13.1%, a difference of 0.43%), and Immigrants from Kazakhstan (13.0%, a difference of 0.53%).
| Demographics | Rating | Rank | Seniors Poverty Over the Age of 75 |
| Immigrants | Brazil | 5.2 /100 | #216 | Tragic 12.9% |
| Bermudans | 4.9 /100 | #217 | Tragic 12.9% |
| Immigrants | Western Asia | 4.9 /100 | #218 | Tragic 12.9% |
| Ute | 4.7 /100 | #219 | Tragic 12.9% |
| Seminole | 4.5 /100 | #220 | Tragic 12.9% |
| Immigrants | Kazakhstan | 4.3 /100 | #221 | Tragic 13.0% |
| Nigerians | 3.4 /100 | #222 | Tragic 13.0% |
| Immigrants | Nigeria | 3.3 /100 | #223 | Tragic 13.0% |
| Chippewa | 2.9 /100 | #224 | Tragic 13.1% |
| Immigrants | Morocco | 2.8 /100 | #225 | Tragic 13.1% |
| Shoshone | 2.6 /100 | #226 | Tragic 13.1% |
| Cree | 2.3 /100 | #227 | Tragic 13.1% |
| Israelis | 2.0 /100 | #228 | Tragic 13.2% |
| Somalis | 1.6 /100 | #229 | Tragic 13.2% |
| Immigrants | China | 1.5 /100 | #230 | Tragic 13.2% |