Lumbee vs Immigrants from Nigeria No Schooling Completed
COMPARE
Lumbee
Immigrants from Nigeria
No Schooling Completed
No Schooling Completed Comparison
Lumbee
Immigrants from Nigeria
1.5%
NO SCHOOLING COMPLETED
100.0/ 100
METRIC RATING
29th/ 347
METRIC RANK
2.5%
NO SCHOOLING COMPLETED
0.2/ 100
METRIC RATING
269th/ 347
METRIC RANK
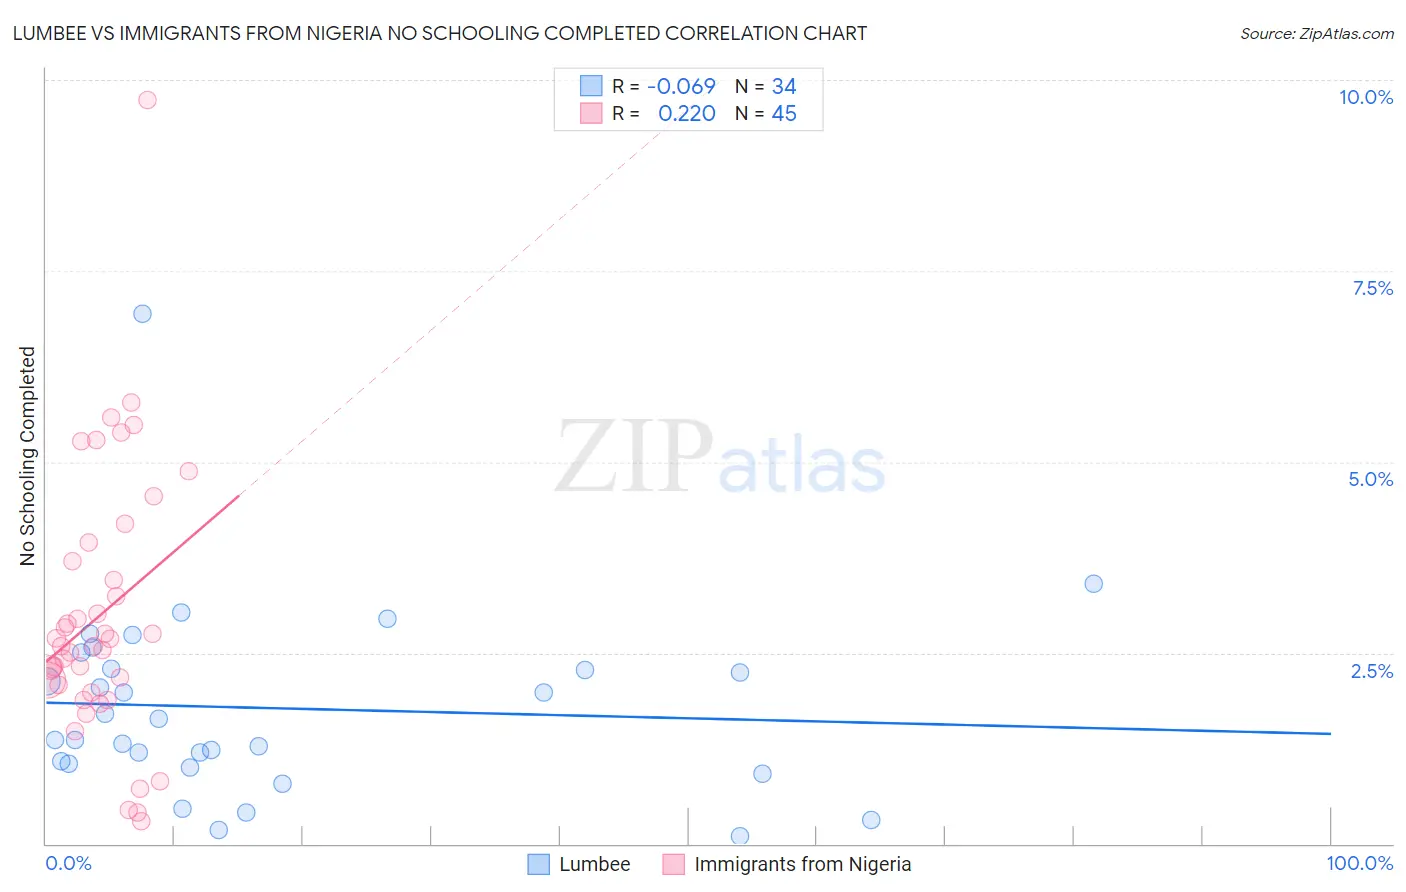
Lumbee vs Immigrants from Nigeria No Schooling Completed Correlation Chart
The statistical analysis conducted on geographies consisting of 91,955,229 people shows a slight negative correlation between the proportion of Lumbee and percentage of population with no schooling in the United States with a correlation coefficient (R) of -0.069 and weighted average of 1.5%. Similarly, the statistical analysis conducted on geographies consisting of 282,263,250 people shows a weak positive correlation between the proportion of Immigrants from Nigeria and percentage of population with no schooling in the United States with a correlation coefficient (R) of 0.220 and weighted average of 2.5%, a difference of 66.0%.
No Schooling Completed Correlation Summary
| Measurement | Lumbee | Immigrants from Nigeria |
| Minimum | 0.093% | 0.30% |
| Maximum | 6.9% | 9.7% |
| Range | 6.9% | 9.4% |
| Mean | 1.8% | 3.0% |
| Median | 1.5% | 2.6% |
| Interquartile 25% (IQ1) | 1.0% | 2.0% |
| Interquartile 75% (IQ3) | 2.3% | 3.8% |
| Interquartile Range (IQR) | 1.2% | 1.8% |
| Standard Deviation (Sample) | 1.3% | 1.8% |
| Standard Deviation (Population) | 1.2% | 1.7% |
Similar Demographics by No Schooling Completed
Demographics Similar to Lumbee by No Schooling Completed
In terms of no schooling completed, the demographic groups most similar to Lumbee are British (1.5%, a difference of 0.48%), Inupiat (1.5%, a difference of 0.51%), French Canadian (1.5%, a difference of 0.91%), Swiss (1.5%, a difference of 0.91%), and Scandinavian (1.5%, a difference of 0.92%).
| Demographics | Rating | Rank | No Schooling Completed |
| Alaska Natives | 100.0 /100 | #22 | Exceptional 1.5% |
| Europeans | 100.0 /100 | #23 | Exceptional 1.5% |
| Pennsylvania Germans | 100.0 /100 | #24 | Exceptional 1.5% |
| French | 100.0 /100 | #25 | Exceptional 1.5% |
| Czechs | 100.0 /100 | #26 | Exceptional 1.5% |
| Scandinavians | 100.0 /100 | #27 | Exceptional 1.5% |
| French Canadians | 100.0 /100 | #28 | Exceptional 1.5% |
| Lumbee | 100.0 /100 | #29 | Exceptional 1.5% |
| British | 100.0 /100 | #30 | Exceptional 1.5% |
| Inupiat | 100.0 /100 | #31 | Exceptional 1.5% |
| Swiss | 100.0 /100 | #32 | Exceptional 1.5% |
| Italians | 100.0 /100 | #33 | Exceptional 1.5% |
| Latvians | 100.0 /100 | #34 | Exceptional 1.5% |
| Eastern Europeans | 100.0 /100 | #35 | Exceptional 1.6% |
| Aleuts | 99.9 /100 | #36 | Exceptional 1.6% |
Demographics Similar to Immigrants from Nigeria by No Schooling Completed
In terms of no schooling completed, the demographic groups most similar to Immigrants from Nigeria are Immigrants from Peru (2.5%, a difference of 0.080%), Cuban (2.5%, a difference of 0.090%), Immigrants from Bolivia (2.5%, a difference of 0.62%), Taiwanese (2.5%, a difference of 0.86%), and Yuman (2.5%, a difference of 1.1%).
| Demographics | Rating | Rank | No Schooling Completed |
| Immigrants | Sierra Leone | 0.5 /100 | #262 | Tragic 2.5% |
| Immigrants | Liberia | 0.4 /100 | #263 | Tragic 2.5% |
| Indians (Asian) | 0.4 /100 | #264 | Tragic 2.5% |
| West Indians | 0.4 /100 | #265 | Tragic 2.5% |
| Fijians | 0.4 /100 | #266 | Tragic 2.5% |
| Yuman | 0.4 /100 | #267 | Tragic 2.5% |
| Taiwanese | 0.3 /100 | #268 | Tragic 2.5% |
| Immigrants | Nigeria | 0.2 /100 | #269 | Tragic 2.5% |
| Immigrants | Peru | 0.2 /100 | #270 | Tragic 2.5% |
| Cubans | 0.2 /100 | #271 | Tragic 2.5% |
| Immigrants | Bolivia | 0.2 /100 | #272 | Tragic 2.5% |
| Immigrants | Cameroon | 0.1 /100 | #273 | Tragic 2.5% |
| Ghanaians | 0.1 /100 | #274 | Tragic 2.6% |
| Immigrants | China | 0.1 /100 | #275 | Tragic 2.6% |
| Immigrants | Western Africa | 0.1 /100 | #276 | Tragic 2.6% |