Immigrants from Western Africa vs Immigrants from Belize Female Poverty
COMPARE
Immigrants from Western Africa
Immigrants from Belize
Female Poverty
Female Poverty Comparison
Immigrants from Western Africa
Immigrants from Belize
15.3%
FEMALE POVERTY
0.3/ 100
METRIC RATING
250th/ 347
METRIC RANK
16.3%
FEMALE POVERTY
0.0/ 100
METRIC RATING
287th/ 347
METRIC RANK
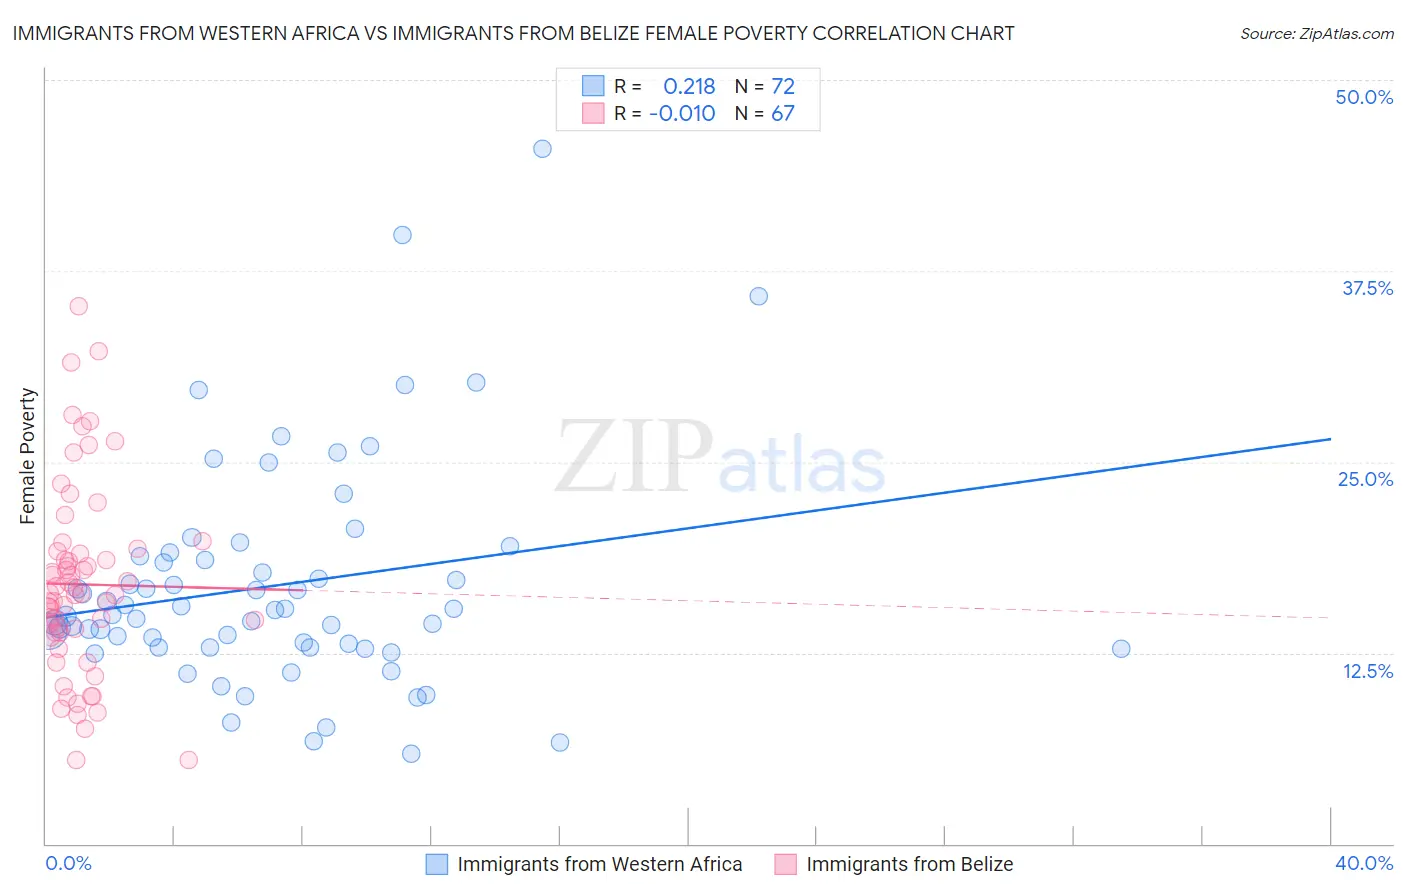
Immigrants from Western Africa vs Immigrants from Belize Female Poverty Correlation Chart
The statistical analysis conducted on geographies consisting of 357,511,733 people shows a weak positive correlation between the proportion of Immigrants from Western Africa and poverty level among females in the United States with a correlation coefficient (R) of 0.218 and weighted average of 15.3%. Similarly, the statistical analysis conducted on geographies consisting of 130,293,638 people shows no correlation between the proportion of Immigrants from Belize and poverty level among females in the United States with a correlation coefficient (R) of -0.010 and weighted average of 16.3%, a difference of 6.1%.
Female Poverty Correlation Summary
| Measurement | Immigrants from Western Africa | Immigrants from Belize |
| Minimum | 5.9% | 5.5% |
| Maximum | 45.5% | 35.2% |
| Range | 39.6% | 29.7% |
| Mean | 16.9% | 17.0% |
| Median | 15.1% | 16.3% |
| Interquartile 25% (IQ1) | 12.8% | 13.8% |
| Interquartile 75% (IQ3) | 18.7% | 19.1% |
| Interquartile Range (IQR) | 5.9% | 5.3% |
| Standard Deviation (Sample) | 7.3% | 6.2% |
| Standard Deviation (Population) | 7.2% | 6.2% |
Similar Demographics by Female Poverty
Demographics Similar to Immigrants from Western Africa by Female Poverty
In terms of female poverty, the demographic groups most similar to Immigrants from Western Africa are Salvadoran (15.3%, a difference of 0.040%), Immigrants from Trinidad and Tobago (15.4%, a difference of 0.16%), Immigrants from Ghana (15.3%, a difference of 0.18%), Cuban (15.3%, a difference of 0.19%), and Potawatomi (15.3%, a difference of 0.19%).
| Demographics | Rating | Rank | Female Poverty |
| Nicaraguans | 0.3 /100 | #243 | Tragic 15.3% |
| Ecuadorians | 0.3 /100 | #244 | Tragic 15.3% |
| Spanish American Indians | 0.3 /100 | #245 | Tragic 15.3% |
| Cubans | 0.3 /100 | #246 | Tragic 15.3% |
| Potawatomi | 0.3 /100 | #247 | Tragic 15.3% |
| Immigrants | Ghana | 0.3 /100 | #248 | Tragic 15.3% |
| Salvadorans | 0.3 /100 | #249 | Tragic 15.3% |
| Immigrants | Western Africa | 0.3 /100 | #250 | Tragic 15.3% |
| Immigrants | Trinidad and Tobago | 0.3 /100 | #251 | Tragic 15.4% |
| Immigrants | Burma/Myanmar | 0.3 /100 | #252 | Tragic 15.4% |
| Liberians | 0.2 /100 | #253 | Tragic 15.4% |
| Trinidadians and Tobagonians | 0.2 /100 | #254 | Tragic 15.4% |
| Ottawa | 0.2 /100 | #255 | Tragic 15.5% |
| Jamaicans | 0.2 /100 | #256 | Tragic 15.5% |
| Immigrants | Jamaica | 0.1 /100 | #257 | Tragic 15.6% |
Demographics Similar to Immigrants from Belize by Female Poverty
In terms of female poverty, the demographic groups most similar to Immigrants from Belize are Inupiat (16.2%, a difference of 0.19%), Indonesian (16.4%, a difference of 0.55%), Blackfeet (16.4%, a difference of 0.56%), Comanche (16.2%, a difference of 0.63%), and Spanish American (16.2%, a difference of 0.71%).
| Demographics | Rating | Rank | Female Poverty |
| Vietnamese | 0.0 /100 | #280 | Tragic 16.1% |
| West Indians | 0.0 /100 | #281 | Tragic 16.1% |
| Immigrants | Haiti | 0.0 /100 | #282 | Tragic 16.1% |
| Immigrants | Cuba | 0.0 /100 | #283 | Tragic 16.1% |
| Spanish Americans | 0.0 /100 | #284 | Tragic 16.2% |
| Comanche | 0.0 /100 | #285 | Tragic 16.2% |
| Inupiat | 0.0 /100 | #286 | Tragic 16.2% |
| Immigrants | Belize | 0.0 /100 | #287 | Tragic 16.3% |
| Indonesians | 0.0 /100 | #288 | Tragic 16.4% |
| Blackfeet | 0.0 /100 | #289 | Tragic 16.4% |
| Immigrants | Bangladesh | 0.0 /100 | #290 | Tragic 16.4% |
| Yaqui | 0.0 /100 | #291 | Tragic 16.4% |
| Immigrants | Zaire | 0.0 /100 | #292 | Tragic 16.4% |
| Immigrants | Latin America | 0.0 /100 | #293 | Tragic 16.4% |
| Immigrants | Cabo Verde | 0.0 /100 | #294 | Tragic 16.4% |