Lithuanian vs Immigrants from Chile Child Poverty Under the Age of 5
COMPARE
Lithuanian
Immigrants from Chile
Child Poverty Under the Age of 5
Child Poverty Under the Age of 5 Comparison
Lithuanians
Immigrants from Chile
15.2%
CHILD POVERTY UNDER THE AGE OF 5
99.0/ 100
METRIC RATING
69th/ 347
METRIC RANK
16.4%
CHILD POVERTY UNDER THE AGE OF 5
85.3/ 100
METRIC RATING
137th/ 347
METRIC RANK
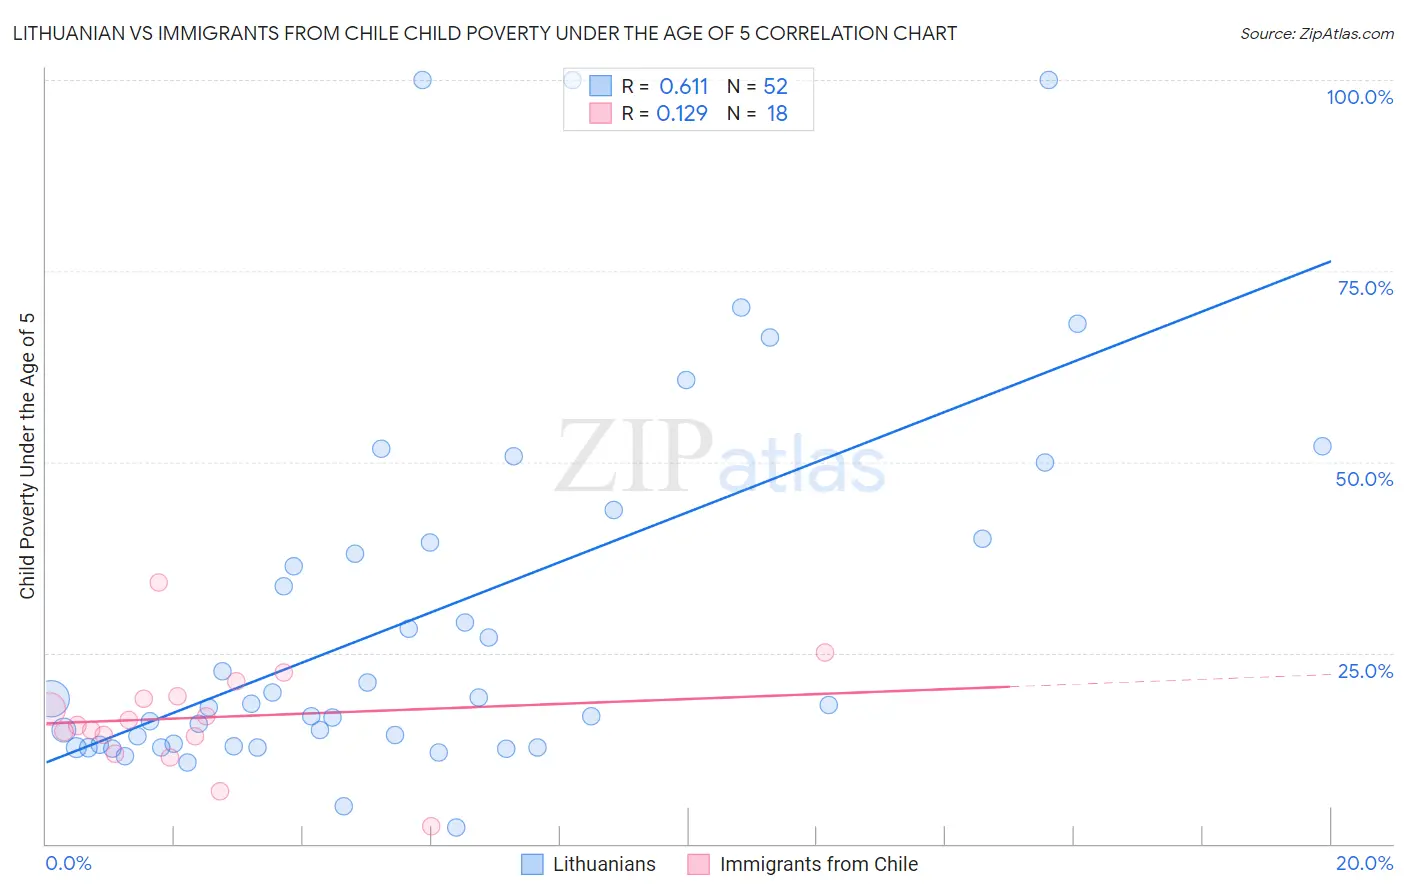
Lithuanian vs Immigrants from Chile Child Poverty Under the Age of 5 Correlation Chart
The statistical analysis conducted on geographies consisting of 398,178,552 people shows a significant positive correlation between the proportion of Lithuanians and poverty level among children under the age of 5 in the United States with a correlation coefficient (R) of 0.611 and weighted average of 15.2%. Similarly, the statistical analysis conducted on geographies consisting of 213,144,685 people shows a poor positive correlation between the proportion of Immigrants from Chile and poverty level among children under the age of 5 in the United States with a correlation coefficient (R) of 0.129 and weighted average of 16.4%, a difference of 8.3%.
Child Poverty Under the Age of 5 Correlation Summary
| Measurement | Lithuanian | Immigrants from Chile |
| Minimum | 2.2% | 2.3% |
| Maximum | 100.0% | 34.3% |
| Range | 97.8% | 32.0% |
| Mean | 29.8% | 16.5% |
| Median | 18.3% | 15.9% |
| Interquartile 25% (IQ1) | 12.9% | 14.0% |
| Interquartile 75% (IQ3) | 39.7% | 19.4% |
| Interquartile Range (IQR) | 26.9% | 5.3% |
| Standard Deviation (Sample) | 24.5% | 7.0% |
| Standard Deviation (Population) | 24.2% | 6.8% |
Similar Demographics by Child Poverty Under the Age of 5
Demographics Similar to Lithuanians by Child Poverty Under the Age of 5
In terms of child poverty under the age of 5, the demographic groups most similar to Lithuanians are Zimbabwean (15.2%, a difference of 0.010%), Greek (15.2%, a difference of 0.020%), Immigrants from Scotland (15.2%, a difference of 0.080%), Immigrants from Fiji (15.2%, a difference of 0.19%), and Immigrants from Romania (15.2%, a difference of 0.22%).
| Demographics | Rating | Rank | Child Poverty Under the Age of 5 |
| Immigrants | Eastern Europe | 99.1 /100 | #62 | Exceptional 15.1% |
| Immigrants | Europe | 99.1 /100 | #63 | Exceptional 15.1% |
| Immigrants | Romania | 99.1 /100 | #64 | Exceptional 15.2% |
| Immigrants | Fiji | 99.0 /100 | #65 | Exceptional 15.2% |
| Immigrants | Scotland | 99.0 /100 | #66 | Exceptional 15.2% |
| Greeks | 99.0 /100 | #67 | Exceptional 15.2% |
| Zimbabweans | 99.0 /100 | #68 | Exceptional 15.2% |
| Lithuanians | 99.0 /100 | #69 | Exceptional 15.2% |
| Immigrants | Belgium | 98.8 /100 | #70 | Exceptional 15.3% |
| Immigrants | Egypt | 98.8 /100 | #71 | Exceptional 15.3% |
| Immigrants | Sweden | 98.8 /100 | #72 | Exceptional 15.3% |
| Immigrants | Ukraine | 98.7 /100 | #73 | Exceptional 15.3% |
| Argentineans | 98.5 /100 | #74 | Exceptional 15.4% |
| Immigrants | Argentina | 98.5 /100 | #75 | Exceptional 15.4% |
| Croatians | 98.5 /100 | #76 | Exceptional 15.4% |
Demographics Similar to Immigrants from Chile by Child Poverty Under the Age of 5
In terms of child poverty under the age of 5, the demographic groups most similar to Immigrants from Chile are German (16.5%, a difference of 0.10%), Immigrants from Hungary (16.5%, a difference of 0.16%), Guamanian/Chamorro (16.5%, a difference of 0.23%), Immigrants from Western Europe (16.5%, a difference of 0.42%), and Portuguese (16.5%, a difference of 0.46%).
| Demographics | Rating | Rank | Child Poverty Under the Age of 5 |
| Immigrants | Norway | 89.3 /100 | #130 | Excellent 16.3% |
| Finns | 88.3 /100 | #131 | Excellent 16.3% |
| Serbians | 88.2 /100 | #132 | Excellent 16.3% |
| Icelanders | 87.9 /100 | #133 | Excellent 16.3% |
| Immigrants | North Macedonia | 87.8 /100 | #134 | Excellent 16.4% |
| Brazilians | 87.8 /100 | #135 | Excellent 16.4% |
| Immigrants | Northern Africa | 87.5 /100 | #136 | Excellent 16.4% |
| Immigrants | Chile | 85.3 /100 | #137 | Excellent 16.4% |
| Germans | 84.8 /100 | #138 | Excellent 16.5% |
| Immigrants | Hungary | 84.5 /100 | #139 | Excellent 16.5% |
| Guamanians/Chamorros | 84.2 /100 | #140 | Excellent 16.5% |
| Immigrants | Western Europe | 83.3 /100 | #141 | Excellent 16.5% |
| Portuguese | 83.0 /100 | #142 | Excellent 16.5% |
| Samoans | 83.0 /100 | #143 | Excellent 16.5% |
| Ethiopians | 82.7 /100 | #144 | Excellent 16.5% |