Hopi vs Immigrants from Chile Married-Couple Family Poverty
COMPARE
Hopi
Immigrants from Chile
Married-Couple Family Poverty
Married-Couple Family Poverty Comparison
Hopi
Immigrants from Chile
7.1%
MARRIED-COUPLE FAMILY POVERTY
0.0/ 100
METRIC RATING
309th/ 347
METRIC RANK
5.3%
MARRIED-COUPLE FAMILY POVERTY
38.8/ 100
METRIC RATING
181st/ 347
METRIC RANK
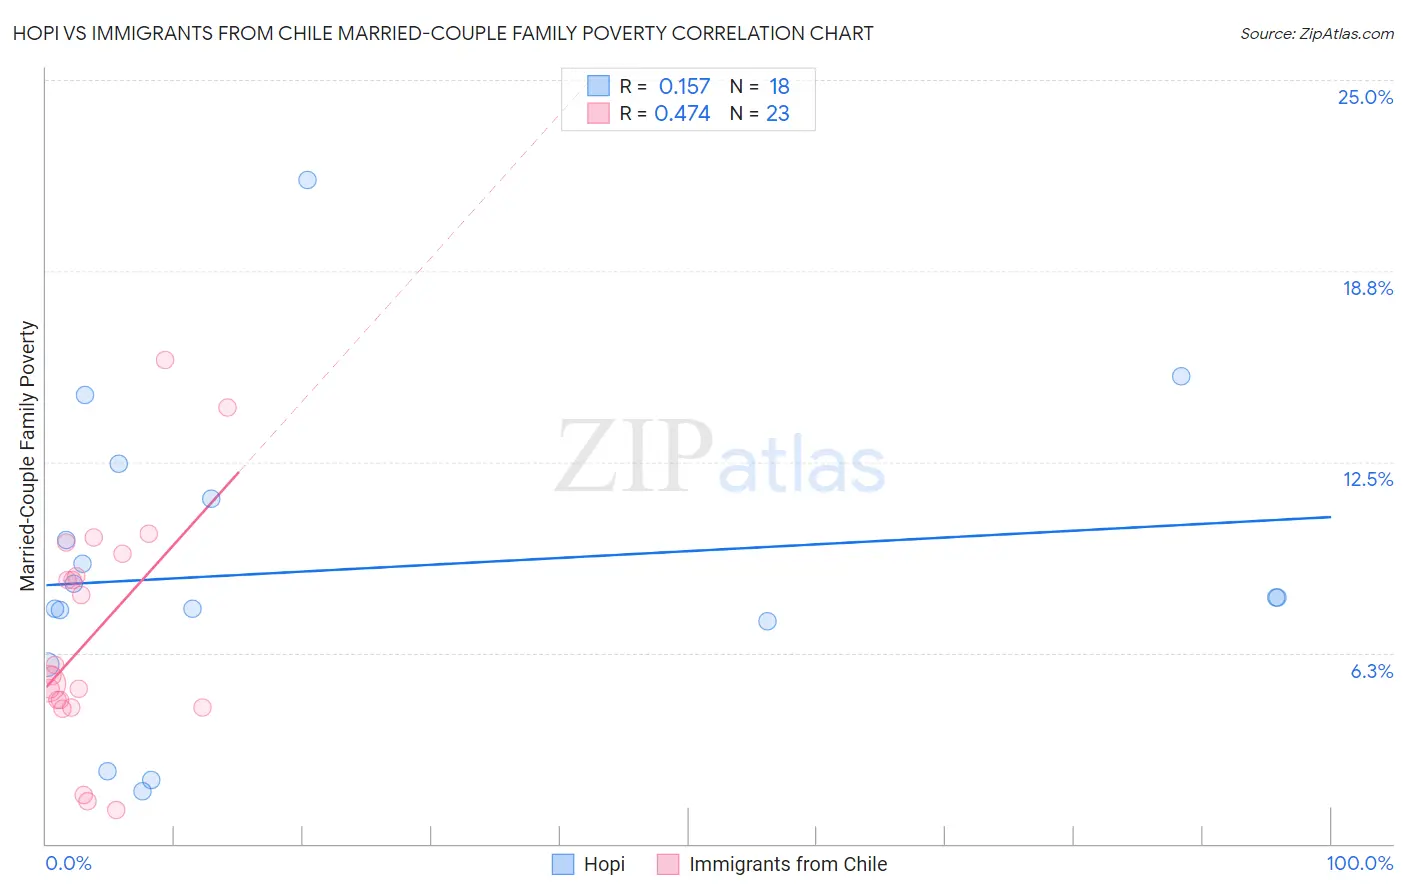
Hopi vs Immigrants from Chile Married-Couple Family Poverty Correlation Chart
The statistical analysis conducted on geographies consisting of 74,623,640 people shows a poor positive correlation between the proportion of Hopi and poverty level among married-couple families in the United States with a correlation coefficient (R) of 0.157 and weighted average of 7.1%. Similarly, the statistical analysis conducted on geographies consisting of 217,797,721 people shows a moderate positive correlation between the proportion of Immigrants from Chile and poverty level among married-couple families in the United States with a correlation coefficient (R) of 0.474 and weighted average of 5.3%, a difference of 34.1%.
Married-Couple Family Poverty Correlation Summary
| Measurement | Hopi | Immigrants from Chile |
| Minimum | 1.7% | 1.1% |
| Maximum | 21.7% | 15.9% |
| Range | 20.0% | 14.8% |
| Mean | 9.0% | 6.8% |
| Median | 8.1% | 5.5% |
| Interquartile 25% (IQ1) | 7.3% | 4.5% |
| Interquartile 75% (IQ3) | 11.3% | 9.5% |
| Interquartile Range (IQR) | 4.0% | 5.0% |
| Standard Deviation (Sample) | 5.0% | 3.8% |
| Standard Deviation (Population) | 4.8% | 3.7% |
Similar Demographics by Married-Couple Family Poverty
Demographics Similar to Hopi by Married-Couple Family Poverty
In terms of married-couple family poverty, the demographic groups most similar to Hopi are Immigrants from Nicaragua (7.1%, a difference of 0.030%), Immigrants from Dominica (7.1%, a difference of 0.080%), Immigrants from Armenia (7.1%, a difference of 0.080%), Immigrants from St. Vincent and the Grenadines (7.1%, a difference of 0.19%), and British West Indian (7.1%, a difference of 0.49%).
| Demographics | Rating | Rank | Married-Couple Family Poverty |
| Immigrants | Ecuador | 0.0 /100 | #302 | Tragic 6.7% |
| Immigrants | El Salvador | 0.0 /100 | #303 | Tragic 6.8% |
| Cubans | 0.0 /100 | #304 | Tragic 6.8% |
| Haitians | 0.0 /100 | #305 | Tragic 6.8% |
| Immigrants | Haiti | 0.0 /100 | #306 | Tragic 7.0% |
| Guatemalans | 0.0 /100 | #307 | Tragic 7.0% |
| Spanish American Indians | 0.0 /100 | #308 | Tragic 7.1% |
| Hopi | 0.0 /100 | #309 | Tragic 7.1% |
| Immigrants | Nicaragua | 0.0 /100 | #310 | Tragic 7.1% |
| Immigrants | Dominica | 0.0 /100 | #311 | Tragic 7.1% |
| Immigrants | Armenia | 0.0 /100 | #312 | Tragic 7.1% |
| Immigrants | St. Vincent and the Grenadines | 0.0 /100 | #313 | Tragic 7.1% |
| British West Indians | 0.0 /100 | #314 | Tragic 7.1% |
| Inupiat | 0.0 /100 | #315 | Tragic 7.1% |
| Hondurans | 0.0 /100 | #316 | Tragic 7.2% |
Demographics Similar to Immigrants from Chile by Married-Couple Family Poverty
In terms of married-couple family poverty, the demographic groups most similar to Immigrants from Chile are Immigrants from Sierra Leone (5.3%, a difference of 0.060%), Immigrants from Vietnam (5.3%, a difference of 0.13%), Peruvian (5.3%, a difference of 0.14%), Spanish (5.3%, a difference of 0.31%), and Nonimmigrants (5.3%, a difference of 0.37%).
| Demographics | Rating | Rank | Married-Couple Family Poverty |
| Immigrants | Eastern Africa | 50.0 /100 | #174 | Average 5.2% |
| Marshallese | 47.9 /100 | #175 | Average 5.2% |
| Menominee | 47.8 /100 | #176 | Average 5.2% |
| Immigrants | Kazakhstan | 45.1 /100 | #177 | Average 5.2% |
| Immigrants | Ukraine | 44.9 /100 | #178 | Average 5.2% |
| Spanish | 41.4 /100 | #179 | Average 5.3% |
| Immigrants | Sierra Leone | 39.3 /100 | #180 | Fair 5.3% |
| Immigrants | Chile | 38.8 /100 | #181 | Fair 5.3% |
| Immigrants | Vietnam | 37.7 /100 | #182 | Fair 5.3% |
| Peruvians | 37.6 /100 | #183 | Fair 5.3% |
| Immigrants | Nonimmigrants | 35.8 /100 | #184 | Fair 5.3% |
| Americans | 35.4 /100 | #185 | Fair 5.3% |
| Hungarians | 34.7 /100 | #186 | Fair 5.3% |
| Immigrants | Albania | 33.8 /100 | #187 | Fair 5.3% |
| Israelis | 33.1 /100 | #188 | Fair 5.3% |