Arapaho vs Immigrants from Chile Married-Couple Family Poverty

COMPARE

Arapaho
Race
Ancestry
AfghanAfricanAlaska NativeAlaskan AthabascanAlbanianAleutAlsatianAmericanApacheArabArapahoArgentineanArmenianAssyrian/Chaldean/SyriacAustralianAustrianBahamianBangladeshiBarbadianBasqueBelgianBelizeanBermudanBhutaneseBlackfeetBolivianBrazilianBritishBritish West IndianBulgarianBurmeseCajunCambodianCanadianCape VerdeanCarpatho RusynCelticCentral AmericanCentral American IndianCherokeeCheyenneChickasawChileanChineseChippewaChoctawColombianColvilleComancheCosta RicanCreeCreekCroatianCrowCubanCypriotCzechCzechoslovakianDanishDelawareDominicanDutchDutch West IndianEastern EuropeanEcuadorianEgyptianEnglishEstonianEthiopianEuropeanFijianFilipinoFinnishFrenchFrench American IndianFrench CanadianGermanGerman RussianGhanaianGreekGuamanian/ChamorroGuatemalanGuyaneseHaitianHmongHonduranHopiHoumaHungarianIcelanderIndian (Asian)IndonesianInupiatIranianIraqiIrishIroquoisIsraeliItalianJamaicanJapaneseJordanianKenyanKiowaKoreanLaotianLatvianLebaneseLiberianLithuanianLumbeeLuxembourgerMacedonianMalaysianMalteseMarshalleseMenomineeMexicanMexican American IndianMongolianMoroccanNative HawaiianNavajoNepaleseNew ZealanderNicaraguanNigerianNorthern EuropeanNorwegianOkinawanOsageOttawaPaiutePakistaniPalestinianPanamanianParaguayanPennsylvania GermanPeruvianPimaPolishPortuguesePotawatomiPuebloPuerto RicanPuget Sound SalishRomanianRussianSalvadoranSamoanScandinavianScotch-IrishScottishSeminoleSenegaleseSerbianShoshoneSierra LeoneanSiouxSlavicSlovakSloveneSomaliSouth AfricanSouth AmericanSouth American IndianSoviet UnionSpaniardSpanishSpanish AmericanSpanish American IndianSri LankanSubsaharan AfricanSudaneseSwedishSwissSyrianTaiwaneseThaiTlingit-HaidaTohono O'OdhamTonganTrinidadian and TobagonianTsimshianTurkishU.S. Virgin IslanderUgandanUkrainianUruguayanUteVenezuelanVietnameseWelshWest IndianYakamaYaquiYugoslavianYumanYup'ikZimbabwean
Immigration
NonimmigrantsImmigrantsAfghanistanAfricaAlbaniaArgentinaArmeniaAsiaAustraliaAustriaBahamasBangladeshBarbadosBelarusBelgiumBelizeBoliviaBosnia and HerzegovinaBrazilBulgariaBurma/MyanmarCabo VerdeCambodiaCameroonCanadaCaribbeanCentral AmericaChinaColombiaCongoCosta RicaCroatiaCubaCzechoslovakiaDenmarkDominicaDominican RepublicEastern AfricaEastern AsiaEastern EuropeEcuadorEgyptEl SalvadorEnglandEritreaEthiopiaEuropeFijiFranceGermanyGhanaGreeceGrenadaGuatemalaGuyanaHaitiHondurasHong KongHungaryIndiaIndonesiaIranIraqIrelandIsraelItalyJamaicaJapanJordanKazakhstanKenyaKoreaKuwaitLaosLatin AmericaLatviaLebanonLiberiaLithuaniaMalaysiaMexicoMicronesiaMiddle AfricaMoldovaMoroccoNepalNetherlandsNicaraguaNigeriaNorth AmericaNorth MacedoniaNorthern AfricaNorthern EuropeNorwayOceaniaPakistanPanamaPeruPhilippinesPolandPortugalRomaniaRussiaSaudi ArabiaScotlandSenegalSerbiaSierra LeoneSingaporeSomaliaSouth AfricaSouth AmericaSouth Central AsiaSouth Eastern AsiaSouthern EuropeSpainSri LankaSt. Vincent and the GrenadinesSudanSwedenSwitzerlandSyriaTaiwanThailandTrinidad and TobagoTurkeyUgandaUkraineUruguayUzbekistanVenezuelaVietnamWest IndiesWestern AfricaWestern AsiaWestern EuropeYemenZaireZimbabweAzores
Immigrants from Chile
Race
Ancestry
AfghanAfricanAlaska NativeAlaskan AthabascanAlbanianAleutAlsatianAmericanApacheArabArgentineanArmenianAssyrian/Chaldean/SyriacAustralianAustrianBahamianBangladeshiBarbadianBasqueBelgianBelizeanBermudanBhutaneseBlackfeetBolivianBrazilianBritishBritish West IndianBulgarianBurmeseCajunCambodianCanadianCape VerdeanCarpatho RusynCelticCentral AmericanCentral American IndianCherokeeCheyenneChickasawChileanChineseChippewaChoctawColombianColvilleComancheCosta RicanCreeCreekCroatianCrowCubanCypriotCzechCzechoslovakianDanishDelawareDominicanDutchDutch West IndianEastern EuropeanEcuadorianEgyptianEnglishEstonianEthiopianEuropeanFijianFilipinoFinnishFrenchFrench American IndianFrench CanadianGermanGerman RussianGhanaianGreekGuamanian/ChamorroGuatemalanGuyaneseHaitianHmongHonduranHopiHoumaHungarianIcelanderIndian (Asian)IndonesianInupiatIranianIraqiIrishIroquoisIsraeliItalianJamaicanJapaneseJordanianKenyanKiowaKoreanLaotianLatvianLebaneseLiberianLithuanianLumbeeLuxembourgerMacedonianMalaysianMalteseMarshalleseMenomineeMexicanMexican American IndianMongolianMoroccanNative HawaiianNavajoNepaleseNew ZealanderNicaraguanNigerianNorthern EuropeanNorwegianOkinawanOsageOttawaPaiutePakistaniPalestinianPanamanianParaguayanPennsylvania GermanPeruvianPimaPolishPortuguesePotawatomiPuebloPuerto RicanPuget Sound SalishRomanianRussianSalvadoranSamoanScandinavianScotch-IrishScottishSeminoleSenegaleseSerbianShoshoneSierra LeoneanSiouxSlavicSlovakSloveneSomaliSouth AfricanSouth AmericanSouth American IndianSoviet UnionSpaniardSpanishSpanish AmericanSpanish American IndianSri LankanSubsaharan AfricanSudaneseSwedishSwissSyrianTaiwaneseThaiTlingit-HaidaTohono O'OdhamTonganTrinidadian and TobagonianTsimshianTurkishU.S. Virgin IslanderUgandanUkrainianUruguayanUteVenezuelanVietnameseWelshWest IndianYakamaYaquiYugoslavianYumanYup'ikZimbabwean
Immigration
NonimmigrantsImmigrantsAfghanistanAfricaAlbaniaArgentinaArmeniaAsiaAustraliaAustriaBahamasBangladeshBarbadosBelarusBelgiumBelizeBoliviaBosnia and HerzegovinaBrazilBulgariaBurma/MyanmarCabo VerdeCambodiaCameroonCanadaCaribbeanCentral AmericaChileChinaColombiaCongoCosta RicaCroatiaCubaCzechoslovakiaDenmarkDominicaDominican RepublicEastern AfricaEastern AsiaEastern EuropeEcuadorEgyptEl SalvadorEnglandEritreaEthiopiaEuropeFijiFranceGermanyGhanaGreeceGrenadaGuatemalaGuyanaHaitiHondurasHong KongHungaryIndiaIndonesiaIranIraqIrelandIsraelItalyJamaicaJapanJordanKazakhstanKenyaKoreaKuwaitLaosLatin AmericaLatviaLebanonLiberiaLithuaniaMalaysiaMexicoMicronesiaMiddle AfricaMoldovaMoroccoNepalNetherlandsNicaraguaNigeriaNorth AmericaNorth MacedoniaNorthern AfricaNorthern EuropeNorwayOceaniaPakistanPanamaPeruPhilippinesPolandPortugalRomaniaRussiaSaudi ArabiaScotlandSenegalSerbiaSierra LeoneSingaporeSomaliaSouth AfricaSouth AmericaSouth Central AsiaSouth Eastern AsiaSouthern EuropeSpainSri LankaSt. Vincent and the GrenadinesSudanSwedenSwitzerlandSyriaTaiwanThailandTrinidad and TobagoTurkeyUgandaUkraineUruguayUzbekistanVenezuelaVietnamWest IndiesWestern AfricaWestern AsiaWestern EuropeYemenZaireZimbabweAzores
Married-Couple Family Poverty
Income
Poverty
Unemployment
Labor Participation
Family Structure
Vehicle Availability
Education Level
Disability

Married-Couple Family Poverty Comparison

Arapaho

Immigrants from Chile

Tragic
Fair
6.6%
MARRIED-COUPLE FAMILY POVERTY
0.0/ 100
METRIC RATING
293rd/ 347
METRIC RANK
5.3%
MARRIED-COUPLE FAMILY POVERTY
38.8/ 100
METRIC RATING
181st/ 347
METRIC RANK

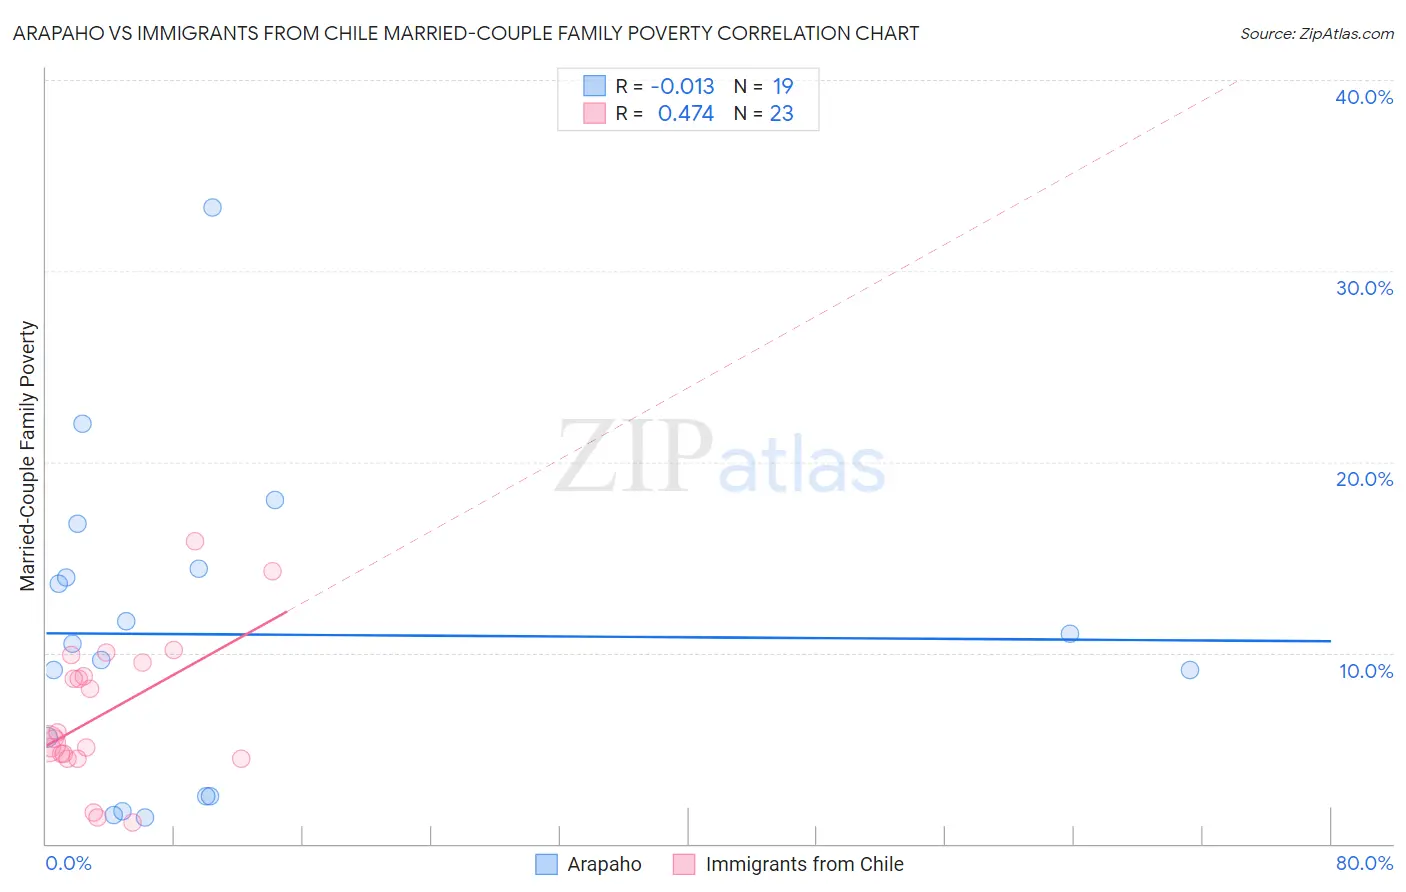
Arapaho vs Immigrants from Chile Married-Couple Family Poverty Correlation Chart

The statistical analysis conducted on geographies consisting of 29,746,597 people shows no correlation between the proportion of Arapaho and poverty level among married-couple families in the United States with a correlation coefficient (R) of -0.013 and weighted average of 6.6%. Similarly, the statistical analysis conducted on geographies consisting of 217,797,721 people shows a moderate positive correlation between the proportion of Immigrants from Chile and poverty level among married-couple families in the United States with a correlation coefficient (R) of 0.474 and weighted average of 5.3%, a difference of 24.2%.
Arapaho vs Immigrants from Chile Married-Couple Family Poverty

Married-Couple Family Poverty Correlation Summary

MeasurementArapahoImmigrants from Chile
Minimum1.4%1.1%
Maximum33.3%15.9%
Range31.9%14.8%
Mean11.0%6.8%
Median10.5%5.5%
Interquartile 25% (IQ1)2.5%4.5%
Interquartile 75% (IQ3)14.4%9.5%
Interquartile Range (IQR)11.9%5.0%
Standard Deviation (Sample)8.1%3.8%
Standard Deviation (Population)7.9%3.7%

Similar Demographics by Married-Couple Family Poverty

Demographics Similar to Arapaho by Married-Couple Family Poverty

In terms of married-couple family poverty, the demographic groups most similar to Arapaho are Immigrants from Lebanon (6.6%, a difference of 0.080%), Belizean (6.5%, a difference of 0.26%), Immigrants from Barbados (6.5%, a difference of 0.29%), Nepalese (6.5%, a difference of 0.52%), and Salvadoran (6.5%, a difference of 0.70%).
DemographicsRating | RankMarried-Couple Family Poverty
Guyanese
0.0
/100
|
#286
Tragic
6.5%
Ecuadorians
0.0
/100
|
#287
Tragic
6.5%
Salvadorans
0.0
/100
|
#288
Tragic
6.5%
Nepalese
0.0
/100
|
#289
Tragic
6.5%
Immigrants | Barbados
0.0
/100
|
#290
Tragic
6.5%
Belizeans
0.0
/100
|
#291
Tragic
6.5%
Immigrants | Lebanon
0.0
/100
|
#292
Tragic
6.6%
Arapaho
0.0
/100
|
#293
Tragic
6.6%
Bahamians
0.0
/100
|
#294
Tragic
6.6%
Immigrants | Uzbekistan
0.0
/100
|
#295
Tragic
6.6%
U.S. Virgin Islanders
0.0
/100
|
#296
Tragic
6.6%
Kiowa
0.0
/100
|
#297
Tragic
6.6%
Immigrants | Guyana
0.0
/100
|
#298
Tragic
6.7%
Nicaraguans
0.0
/100
|
#299
Tragic
6.7%
Immigrants | Belize
0.0
/100
|
#300
Tragic
6.7%

Demographics Similar to Immigrants from Chile by Married-Couple Family Poverty

In terms of married-couple family poverty, the demographic groups most similar to Immigrants from Chile are Immigrants from Sierra Leone (5.3%, a difference of 0.060%), Immigrants from Vietnam (5.3%, a difference of 0.13%), Peruvian (5.3%, a difference of 0.14%), Spanish (5.3%, a difference of 0.31%), and Nonimmigrants (5.3%, a difference of 0.37%).
DemographicsRating | RankMarried-Couple Family Poverty
Immigrants | Eastern Africa
50.0
/100
|
#174
Average
5.2%
Marshallese
47.9
/100
|
#175
Average
5.2%
Menominee
47.8
/100
|
#176
Average
5.2%
Immigrants | Kazakhstan
45.1
/100
|
#177
Average
5.2%
Immigrants | Ukraine
44.9
/100
|
#178
Average
5.2%
Spanish
41.4
/100
|
#179
Average
5.3%
Immigrants | Sierra Leone
39.3
/100
|
#180
Fair
5.3%
Immigrants | Chile
38.8
/100
|
#181
Fair
5.3%
Immigrants | Vietnam
37.7
/100
|
#182
Fair
5.3%
Peruvians
37.6
/100
|
#183
Fair
5.3%
Immigrants | Nonimmigrants
35.8
/100
|
#184
Fair
5.3%
Americans
35.4
/100
|
#185
Fair
5.3%
Hungarians
34.7
/100
|
#186
Fair
5.3%
Immigrants | Albania
33.8
/100
|
#187
Fair
5.3%
Israelis
33.1
/100
|
#188
Fair
5.3%