Immigrants from Netherlands vs Immigrants from Chile Married-Couple Family Poverty
COMPARE
Immigrants from Netherlands
Immigrants from Chile
Married-Couple Family Poverty
Married-Couple Family Poverty Comparison
Immigrants from Netherlands
Immigrants from Chile
4.3%
MARRIED-COUPLE FAMILY POVERTY
99.7/ 100
METRIC RATING
57th/ 347
METRIC RANK
5.3%
MARRIED-COUPLE FAMILY POVERTY
38.8/ 100
METRIC RATING
181st/ 347
METRIC RANK
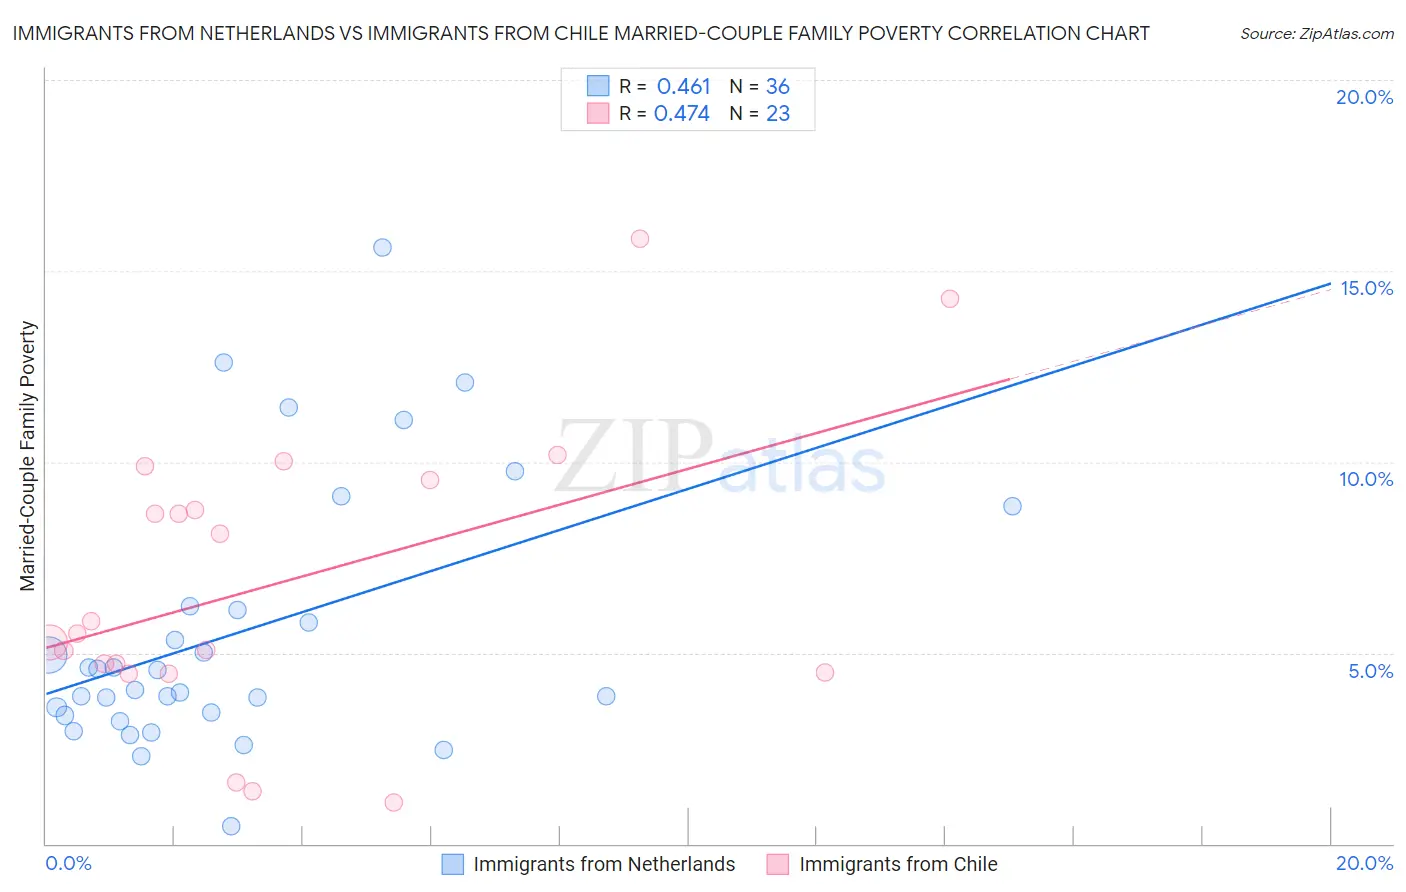
Immigrants from Netherlands vs Immigrants from Chile Married-Couple Family Poverty Correlation Chart
The statistical analysis conducted on geographies consisting of 236,404,410 people shows a moderate positive correlation between the proportion of Immigrants from Netherlands and poverty level among married-couple families in the United States with a correlation coefficient (R) of 0.461 and weighted average of 4.3%. Similarly, the statistical analysis conducted on geographies consisting of 217,797,721 people shows a moderate positive correlation between the proportion of Immigrants from Chile and poverty level among married-couple families in the United States with a correlation coefficient (R) of 0.474 and weighted average of 5.3%, a difference of 21.7%.
Married-Couple Family Poverty Correlation Summary
| Measurement | Immigrants from Netherlands | Immigrants from Chile |
| Minimum | 0.44% | 1.1% |
| Maximum | 15.6% | 15.9% |
| Range | 15.2% | 14.8% |
| Mean | 5.5% | 6.8% |
| Median | 4.3% | 5.5% |
| Interquartile 25% (IQ1) | 3.4% | 4.5% |
| Interquartile 75% (IQ3) | 6.2% | 9.5% |
| Interquartile Range (IQR) | 2.8% | 5.0% |
| Standard Deviation (Sample) | 3.5% | 3.8% |
| Standard Deviation (Population) | 3.4% | 3.7% |
Similar Demographics by Married-Couple Family Poverty
Demographics Similar to Immigrants from Netherlands by Married-Couple Family Poverty
In terms of married-couple family poverty, the demographic groups most similar to Immigrants from Netherlands are Immigrants from Zimbabwe (4.3%, a difference of 0.0%), Czechoslovakian (4.4%, a difference of 0.090%), French (4.3%, a difference of 0.16%), Austrian (4.3%, a difference of 0.18%), and Welsh (4.3%, a difference of 0.45%).
| Demographics | Rating | Rank | Married-Couple Family Poverty |
| Burmese | 99.7 /100 | #50 | Exceptional 4.3% |
| Immigrants | Lithuania | 99.7 /100 | #51 | Exceptional 4.3% |
| Russians | 99.7 /100 | #52 | Exceptional 4.3% |
| Welsh | 99.7 /100 | #53 | Exceptional 4.3% |
| Austrians | 99.7 /100 | #54 | Exceptional 4.3% |
| French | 99.7 /100 | #55 | Exceptional 4.3% |
| Immigrants | Zimbabwe | 99.7 /100 | #56 | Exceptional 4.3% |
| Immigrants | Netherlands | 99.7 /100 | #57 | Exceptional 4.3% |
| Czechoslovakians | 99.7 /100 | #58 | Exceptional 4.4% |
| Immigrants | Sweden | 99.6 /100 | #59 | Exceptional 4.4% |
| Tlingit-Haida | 99.6 /100 | #60 | Exceptional 4.4% |
| Okinawans | 99.6 /100 | #61 | Exceptional 4.4% |
| Immigrants | Australia | 99.6 /100 | #62 | Exceptional 4.4% |
| Immigrants | Sri Lanka | 99.6 /100 | #63 | Exceptional 4.4% |
| Immigrants | Bulgaria | 99.5 /100 | #64 | Exceptional 4.4% |
Demographics Similar to Immigrants from Chile by Married-Couple Family Poverty
In terms of married-couple family poverty, the demographic groups most similar to Immigrants from Chile are Immigrants from Sierra Leone (5.3%, a difference of 0.060%), Immigrants from Vietnam (5.3%, a difference of 0.13%), Peruvian (5.3%, a difference of 0.14%), Spanish (5.3%, a difference of 0.31%), and Nonimmigrants (5.3%, a difference of 0.37%).
| Demographics | Rating | Rank | Married-Couple Family Poverty |
| Immigrants | Eastern Africa | 50.0 /100 | #174 | Average 5.2% |
| Marshallese | 47.9 /100 | #175 | Average 5.2% |
| Menominee | 47.8 /100 | #176 | Average 5.2% |
| Immigrants | Kazakhstan | 45.1 /100 | #177 | Average 5.2% |
| Immigrants | Ukraine | 44.9 /100 | #178 | Average 5.2% |
| Spanish | 41.4 /100 | #179 | Average 5.3% |
| Immigrants | Sierra Leone | 39.3 /100 | #180 | Fair 5.3% |
| Immigrants | Chile | 38.8 /100 | #181 | Fair 5.3% |
| Immigrants | Vietnam | 37.7 /100 | #182 | Fair 5.3% |
| Peruvians | 37.6 /100 | #183 | Fair 5.3% |
| Immigrants | Nonimmigrants | 35.8 /100 | #184 | Fair 5.3% |
| Americans | 35.4 /100 | #185 | Fair 5.3% |
| Hungarians | 34.7 /100 | #186 | Fair 5.3% |
| Immigrants | Albania | 33.8 /100 | #187 | Fair 5.3% |
| Israelis | 33.1 /100 | #188 | Fair 5.3% |