Kenyan vs Cypriot Married-Couple Family Poverty
COMPARE
Kenyan
Cypriot
Married-Couple Family Poverty
Married-Couple Family Poverty Comparison
Kenyans
Cypriots
4.8%
MARRIED-COUPLE FAMILY POVERTY
94.7/ 100
METRIC RATING
117th/ 347
METRIC RANK
4.1%
MARRIED-COUPLE FAMILY POVERTY
99.9/ 100
METRIC RATING
26th/ 347
METRIC RANK
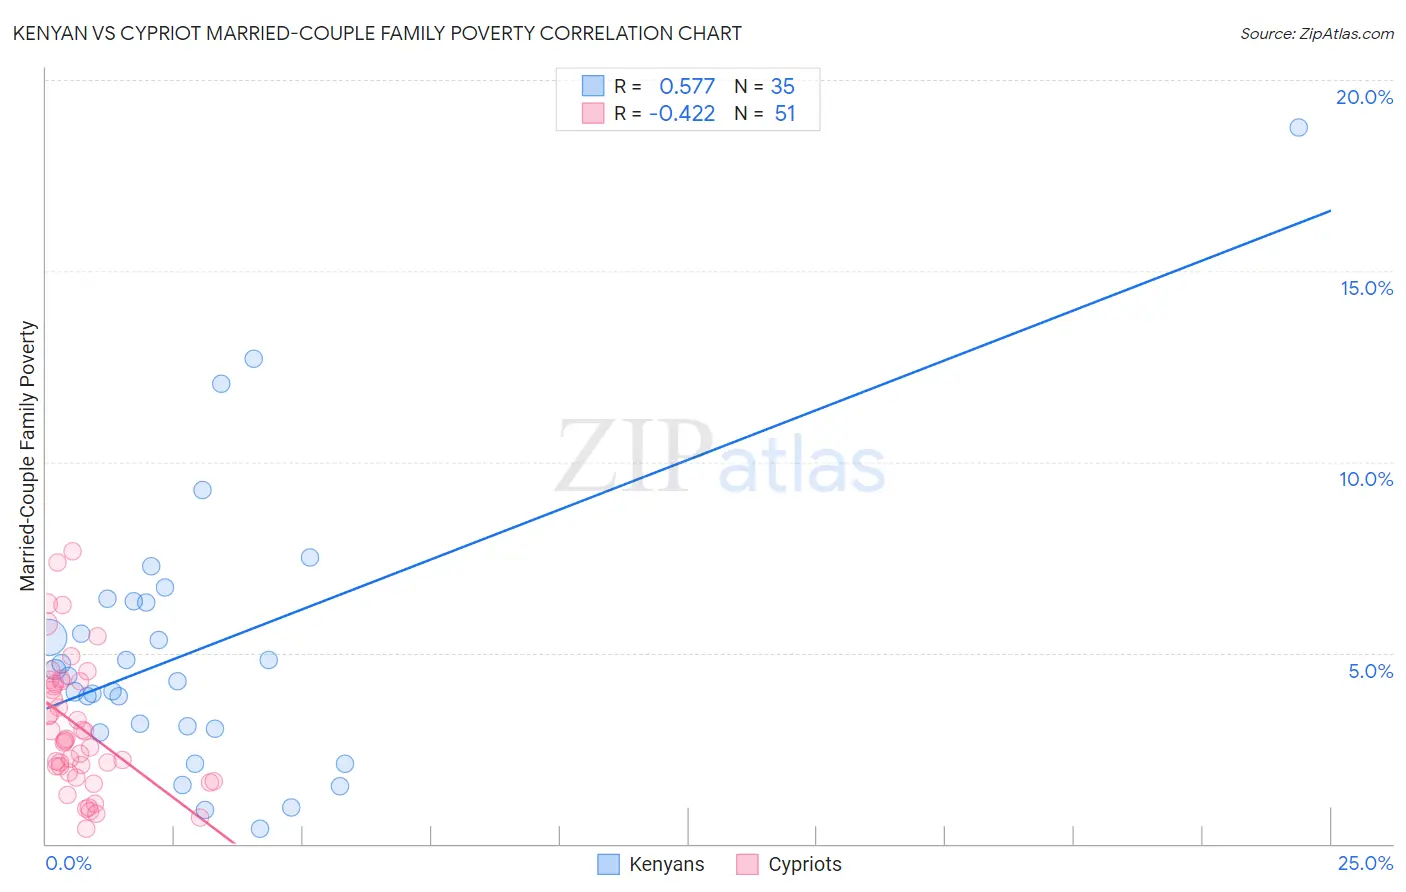
Kenyan vs Cypriot Married-Couple Family Poverty Correlation Chart
The statistical analysis conducted on geographies consisting of 167,574,201 people shows a substantial positive correlation between the proportion of Kenyans and poverty level among married-couple families in the United States with a correlation coefficient (R) of 0.577 and weighted average of 4.8%. Similarly, the statistical analysis conducted on geographies consisting of 61,691,047 people shows a moderate negative correlation between the proportion of Cypriots and poverty level among married-couple families in the United States with a correlation coefficient (R) of -0.422 and weighted average of 4.1%, a difference of 15.5%.
Married-Couple Family Poverty Correlation Summary
| Measurement | Kenyan | Cypriot |
| Minimum | 0.40% | 0.39% |
| Maximum | 18.8% | 7.7% |
| Range | 18.3% | 7.3% |
| Mean | 5.1% | 3.1% |
| Median | 4.4% | 2.7% |
| Interquartile 25% (IQ1) | 3.0% | 1.9% |
| Interquartile 75% (IQ3) | 6.3% | 4.2% |
| Interquartile Range (IQR) | 3.3% | 2.4% |
| Standard Deviation (Sample) | 3.7% | 1.7% |
| Standard Deviation (Population) | 3.6% | 1.7% |
Similar Demographics by Married-Couple Family Poverty
Demographics Similar to Kenyans by Married-Couple Family Poverty
In terms of married-couple family poverty, the demographic groups most similar to Kenyans are Immigrants from Philippines (4.8%, a difference of 0.020%), Celtic (4.8%, a difference of 0.10%), Taiwanese (4.8%, a difference of 0.11%), Immigrants from Indonesia (4.8%, a difference of 0.26%), and Immigrants from Eastern Asia (4.8%, a difference of 0.39%).
| Demographics | Rating | Rank | Married-Couple Family Poverty |
| Immigrants | Bolivia | 96.2 /100 | #110 | Exceptional 4.7% |
| Pakistanis | 96.2 /100 | #111 | Exceptional 4.7% |
| Tongans | 95.9 /100 | #112 | Exceptional 4.7% |
| Immigrants | Nepal | 95.9 /100 | #113 | Exceptional 4.7% |
| Immigrants | Indonesia | 95.1 /100 | #114 | Exceptional 4.8% |
| Taiwanese | 94.8 /100 | #115 | Exceptional 4.8% |
| Celtics | 94.8 /100 | #116 | Exceptional 4.8% |
| Kenyans | 94.7 /100 | #117 | Exceptional 4.8% |
| Immigrants | Philippines | 94.6 /100 | #118 | Exceptional 4.8% |
| Immigrants | Eastern Asia | 94.0 /100 | #119 | Exceptional 4.8% |
| Immigrants | Southern Europe | 93.4 /100 | #120 | Exceptional 4.8% |
| Indians (Asian) | 93.2 /100 | #121 | Exceptional 4.8% |
| Whites/Caucasians | 93.1 /100 | #122 | Exceptional 4.8% |
| Jordanians | 93.1 /100 | #123 | Exceptional 4.8% |
| Romanians | 92.5 /100 | #124 | Exceptional 4.8% |
Demographics Similar to Cypriots by Married-Couple Family Poverty
In terms of married-couple family poverty, the demographic groups most similar to Cypriots are Danish (4.1%, a difference of 0.11%), Scandinavian (4.1%, a difference of 0.22%), Immigrants from Scotland (4.2%, a difference of 0.26%), Immigrants from Taiwan (4.1%, a difference of 0.27%), and Finnish (4.2%, a difference of 0.50%).
| Demographics | Rating | Rank | Married-Couple Family Poverty |
| Immigrants | Ireland | 99.9 /100 | #19 | Exceptional 4.1% |
| Maltese | 99.9 /100 | #20 | Exceptional 4.1% |
| Zimbabweans | 99.9 /100 | #21 | Exceptional 4.1% |
| Immigrants | Singapore | 99.9 /100 | #22 | Exceptional 4.1% |
| Bhutanese | 99.9 /100 | #23 | Exceptional 4.1% |
| Eastern Europeans | 99.9 /100 | #24 | Exceptional 4.1% |
| Immigrants | Taiwan | 99.9 /100 | #25 | Exceptional 4.1% |
| Cypriots | 99.9 /100 | #26 | Exceptional 4.1% |
| Danes | 99.9 /100 | #27 | Exceptional 4.1% |
| Scandinavians | 99.9 /100 | #28 | Exceptional 4.1% |
| Immigrants | Scotland | 99.9 /100 | #29 | Exceptional 4.2% |
| Finns | 99.9 /100 | #30 | Exceptional 4.2% |
| Estonians | 99.9 /100 | #31 | Exceptional 4.2% |
| Greeks | 99.9 /100 | #32 | Exceptional 4.2% |
| Irish | 99.9 /100 | #33 | Exceptional 4.2% |