Kenyan vs Immigrants from North America Married-Couple Family Poverty
COMPARE
Kenyan
Immigrants from North America
Married-Couple Family Poverty
Married-Couple Family Poverty Comparison
Kenyans
Immigrants from North America
4.8%
MARRIED-COUPLE FAMILY POVERTY
94.7/ 100
METRIC RATING
117th/ 347
METRIC RANK
4.5%
MARRIED-COUPLE FAMILY POVERTY
99.3/ 100
METRIC RATING
71st/ 347
METRIC RANK
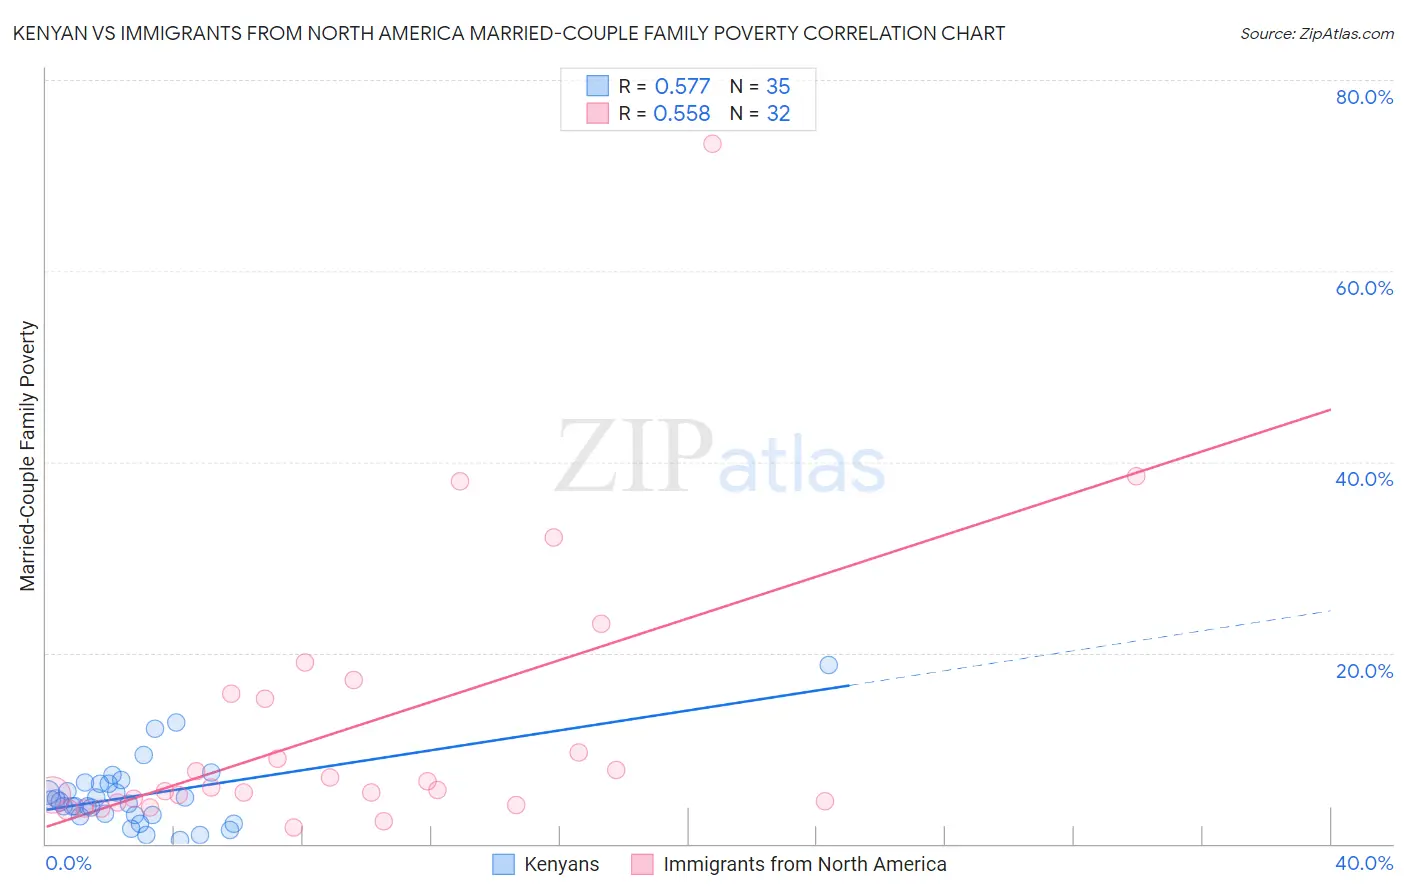
Kenyan vs Immigrants from North America Married-Couple Family Poverty Correlation Chart
The statistical analysis conducted on geographies consisting of 167,574,201 people shows a substantial positive correlation between the proportion of Kenyans and poverty level among married-couple families in the United States with a correlation coefficient (R) of 0.577 and weighted average of 4.8%. Similarly, the statistical analysis conducted on geographies consisting of 456,163,835 people shows a substantial positive correlation between the proportion of Immigrants from North America and poverty level among married-couple families in the United States with a correlation coefficient (R) of 0.558 and weighted average of 4.5%, a difference of 7.0%.
Married-Couple Family Poverty Correlation Summary
| Measurement | Kenyan | Immigrants from North America |
| Minimum | 0.40% | 1.7% |
| Maximum | 18.8% | 73.3% |
| Range | 18.3% | 71.6% |
| Mean | 5.1% | 12.3% |
| Median | 4.4% | 5.7% |
| Interquartile 25% (IQ1) | 3.0% | 4.4% |
| Interquartile 75% (IQ3) | 6.3% | 15.5% |
| Interquartile Range (IQR) | 3.3% | 11.0% |
| Standard Deviation (Sample) | 3.7% | 14.9% |
| Standard Deviation (Population) | 3.6% | 14.7% |
Similar Demographics by Married-Couple Family Poverty
Demographics Similar to Kenyans by Married-Couple Family Poverty
In terms of married-couple family poverty, the demographic groups most similar to Kenyans are Immigrants from Philippines (4.8%, a difference of 0.020%), Celtic (4.8%, a difference of 0.10%), Taiwanese (4.8%, a difference of 0.11%), Immigrants from Indonesia (4.8%, a difference of 0.26%), and Immigrants from Eastern Asia (4.8%, a difference of 0.39%).
| Demographics | Rating | Rank | Married-Couple Family Poverty |
| Immigrants | Bolivia | 96.2 /100 | #110 | Exceptional 4.7% |
| Pakistanis | 96.2 /100 | #111 | Exceptional 4.7% |
| Tongans | 95.9 /100 | #112 | Exceptional 4.7% |
| Immigrants | Nepal | 95.9 /100 | #113 | Exceptional 4.7% |
| Immigrants | Indonesia | 95.1 /100 | #114 | Exceptional 4.8% |
| Taiwanese | 94.8 /100 | #115 | Exceptional 4.8% |
| Celtics | 94.8 /100 | #116 | Exceptional 4.8% |
| Kenyans | 94.7 /100 | #117 | Exceptional 4.8% |
| Immigrants | Philippines | 94.6 /100 | #118 | Exceptional 4.8% |
| Immigrants | Eastern Asia | 94.0 /100 | #119 | Exceptional 4.8% |
| Immigrants | Southern Europe | 93.4 /100 | #120 | Exceptional 4.8% |
| Indians (Asian) | 93.2 /100 | #121 | Exceptional 4.8% |
| Whites/Caucasians | 93.1 /100 | #122 | Exceptional 4.8% |
| Jordanians | 93.1 /100 | #123 | Exceptional 4.8% |
| Romanians | 92.5 /100 | #124 | Exceptional 4.8% |
Demographics Similar to Immigrants from North America by Married-Couple Family Poverty
In terms of married-couple family poverty, the demographic groups most similar to Immigrants from North America are Immigrants from England (4.5%, a difference of 0.090%), Ukrainian (4.5%, a difference of 0.22%), Immigrants from Austria (4.5%, a difference of 0.32%), Immigrants from Korea (4.5%, a difference of 0.42%), and New Zealander (4.4%, a difference of 0.55%).
| Demographics | Rating | Rank | Married-Couple Family Poverty |
| Immigrants | Bulgaria | 99.5 /100 | #64 | Exceptional 4.4% |
| Macedonians | 99.4 /100 | #65 | Exceptional 4.4% |
| Immigrants | Serbia | 99.4 /100 | #66 | Exceptional 4.4% |
| Immigrants | Canada | 99.4 /100 | #67 | Exceptional 4.4% |
| Slavs | 99.4 /100 | #68 | Exceptional 4.4% |
| New Zealanders | 99.4 /100 | #69 | Exceptional 4.4% |
| Immigrants | Korea | 99.4 /100 | #70 | Exceptional 4.5% |
| Immigrants | North America | 99.3 /100 | #71 | Exceptional 4.5% |
| Immigrants | England | 99.3 /100 | #72 | Exceptional 4.5% |
| Ukrainians | 99.2 /100 | #73 | Exceptional 4.5% |
| Immigrants | Austria | 99.2 /100 | #74 | Exceptional 4.5% |
| Cambodians | 99.2 /100 | #75 | Exceptional 4.5% |
| Immigrants | South Africa | 99.1 /100 | #76 | Exceptional 4.5% |
| Immigrants | Latvia | 99.1 /100 | #77 | Exceptional 4.5% |
| Scotch-Irish | 99.1 /100 | #78 | Exceptional 4.5% |