Kenyan vs Trinidadian and Tobagonian 1 or more Vehicles in Household
COMPARE
Kenyan
Trinidadian and Tobagonian
1 or more Vehicles in Household
1 or more Vehicles in Household Comparison
Kenyans
Trinidadians and Tobagonians
90.4%
1 OR MORE VEHICLES IN HOUSEHOLD
87.0/ 100
METRIC RATING
134th/ 347
METRIC RANK
76.3%
1 OR MORE VEHICLES IN HOUSEHOLD
0.0/ 100
METRIC RATING
332nd/ 347
METRIC RANK
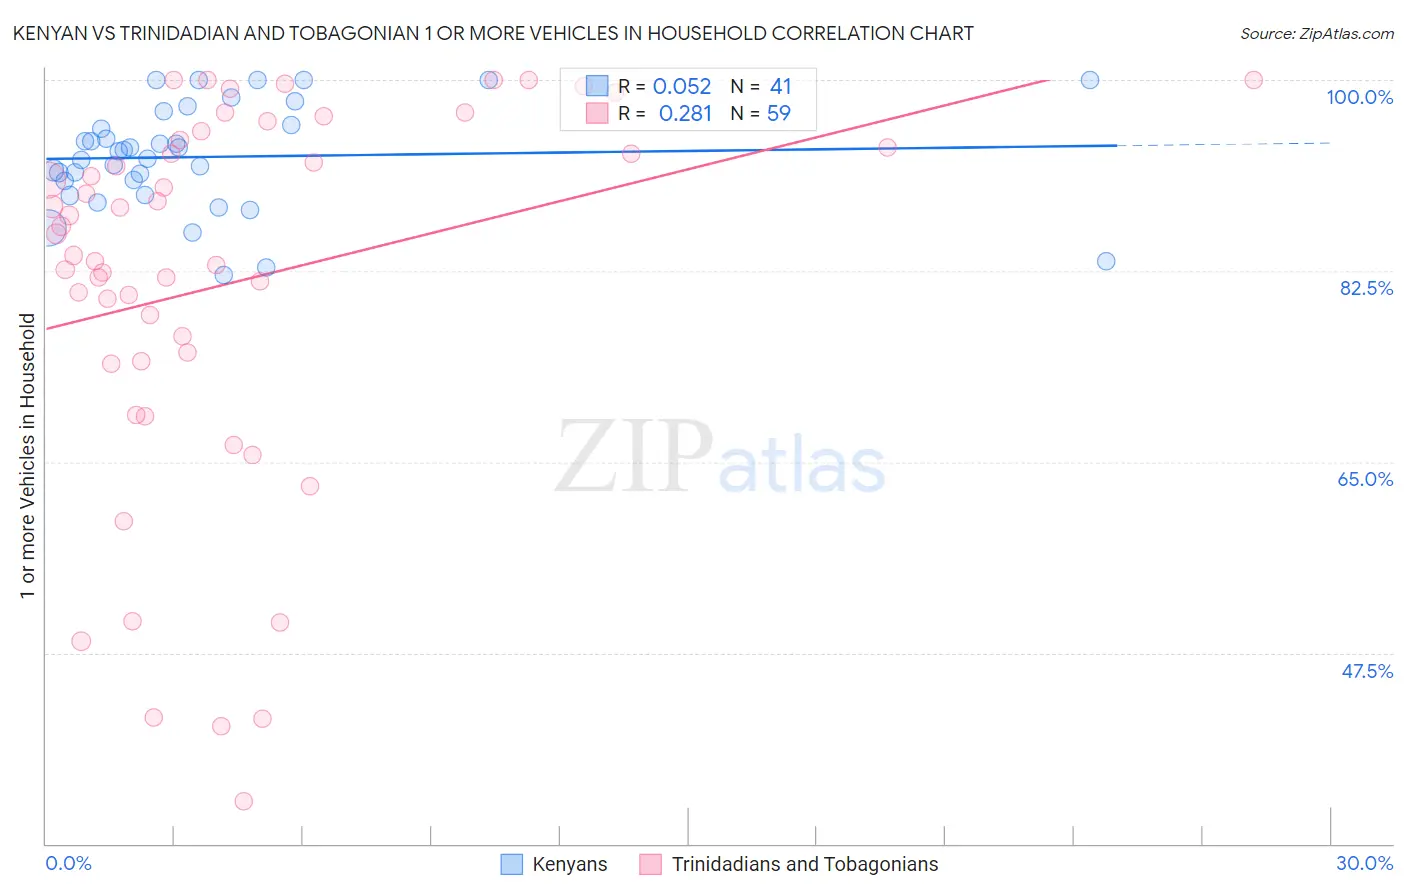
Kenyan vs Trinidadian and Tobagonian 1 or more Vehicles in Household Correlation Chart
The statistical analysis conducted on geographies consisting of 168,180,305 people shows a slight positive correlation between the proportion of Kenyans and percentage of households with 1 or more vehicles available in the United States with a correlation coefficient (R) of 0.052 and weighted average of 90.4%. Similarly, the statistical analysis conducted on geographies consisting of 219,744,426 people shows a weak positive correlation between the proportion of Trinidadians and Tobagonians and percentage of households with 1 or more vehicles available in the United States with a correlation coefficient (R) of 0.281 and weighted average of 76.3%, a difference of 18.4%.
1 or more Vehicles in Household Correlation Summary
| Measurement | Kenyan | Trinidadian and Tobagonian |
| Minimum | 82.2% | 33.9% |
| Maximum | 100.0% | 100.0% |
| Range | 17.8% | 66.1% |
| Mean | 93.0% | 81.5% |
| Median | 93.4% | 85.9% |
| Interquartile 25% (IQ1) | 90.1% | 74.2% |
| Interquartile 75% (IQ3) | 96.5% | 94.5% |
| Interquartile Range (IQR) | 6.4% | 20.3% |
| Standard Deviation (Sample) | 4.8% | 17.3% |
| Standard Deviation (Population) | 4.8% | 17.2% |
Similar Demographics by 1 or more Vehicles in Household
Demographics Similar to Kenyans by 1 or more Vehicles in Household
In terms of 1 or more vehicles in household, the demographic groups most similar to Kenyans are Immigrants from Oceania (90.4%, a difference of 0.0%), Immigrants from Syria (90.4%, a difference of 0.020%), Hungarian (90.3%, a difference of 0.020%), Latvian (90.3%, a difference of 0.020%), and Syrian (90.3%, a difference of 0.020%).
| Demographics | Rating | Rank | 1 or more Vehicles in Household |
| Immigrants | Azores | 89.1 /100 | #127 | Excellent 90.4% |
| Burmese | 89.0 /100 | #128 | Excellent 90.4% |
| Marshallese | 88.9 /100 | #129 | Excellent 90.4% |
| Nicaraguans | 88.8 /100 | #130 | Excellent 90.4% |
| Immigrants | Kenya | 88.5 /100 | #131 | Excellent 90.4% |
| Immigrants | South Africa | 88.1 /100 | #132 | Excellent 90.4% |
| Immigrants | Syria | 87.5 /100 | #133 | Excellent 90.4% |
| Kenyans | 87.0 /100 | #134 | Excellent 90.4% |
| Immigrants | Oceania | 86.9 /100 | #135 | Excellent 90.4% |
| Hungarians | 86.5 /100 | #136 | Excellent 90.3% |
| Latvians | 86.3 /100 | #137 | Excellent 90.3% |
| Syrians | 86.3 /100 | #138 | Excellent 90.3% |
| Estonians | 85.6 /100 | #139 | Excellent 90.3% |
| Sudanese | 85.2 /100 | #140 | Excellent 90.3% |
| Immigrants | Moldova | 83.1 /100 | #141 | Excellent 90.2% |
Demographics Similar to Trinidadians and Tobagonians by 1 or more Vehicles in Household
In terms of 1 or more vehicles in household, the demographic groups most similar to Trinidadians and Tobagonians are West Indian (76.4%, a difference of 0.080%), Immigrants from Ecuador (76.2%, a difference of 0.10%), Immigrants from Trinidad and Tobago (76.8%, a difference of 0.64%), Immigrants from Dominica (77.8%, a difference of 2.0%), and Ecuadorian (77.9%, a difference of 2.1%).
| Demographics | Rating | Rank | 1 or more Vehicles in Household |
| Senegalese | 0.0 /100 | #325 | Tragic 80.4% |
| Immigrants | West Indies | 0.0 /100 | #326 | Tragic 79.5% |
| Immigrants | Senegal | 0.0 /100 | #327 | Tragic 79.0% |
| Ecuadorians | 0.0 /100 | #328 | Tragic 77.9% |
| Immigrants | Dominica | 0.0 /100 | #329 | Tragic 77.8% |
| Immigrants | Trinidad and Tobago | 0.0 /100 | #330 | Tragic 76.8% |
| West Indians | 0.0 /100 | #331 | Tragic 76.4% |
| Trinidadians and Tobagonians | 0.0 /100 | #332 | Tragic 76.3% |
| Immigrants | Ecuador | 0.0 /100 | #333 | Tragic 76.2% |
| Immigrants | Bangladesh | 0.0 /100 | #334 | Tragic 74.3% |
| Barbadians | 0.0 /100 | #335 | Tragic 74.0% |
| Vietnamese | 0.0 /100 | #336 | Tragic 73.8% |
| Immigrants | Uzbekistan | 0.0 /100 | #337 | Tragic 73.4% |
| Inupiat | 0.0 /100 | #338 | Tragic 71.5% |
| Guyanese | 0.0 /100 | #339 | Tragic 70.8% |