Kenyan vs Trinidadian and Tobagonian Nursery School
COMPARE
Kenyan
Trinidadian and Tobagonian
Nursery School
Nursery School Comparison
Kenyans
Trinidadians and Tobagonians
98.0%
NURSERY SCHOOL
50.2/ 100
METRIC RATING
173rd/ 347
METRIC RANK
97.4%
NURSERY SCHOOL
0.0/ 100
METRIC RATING
281st/ 347
METRIC RANK
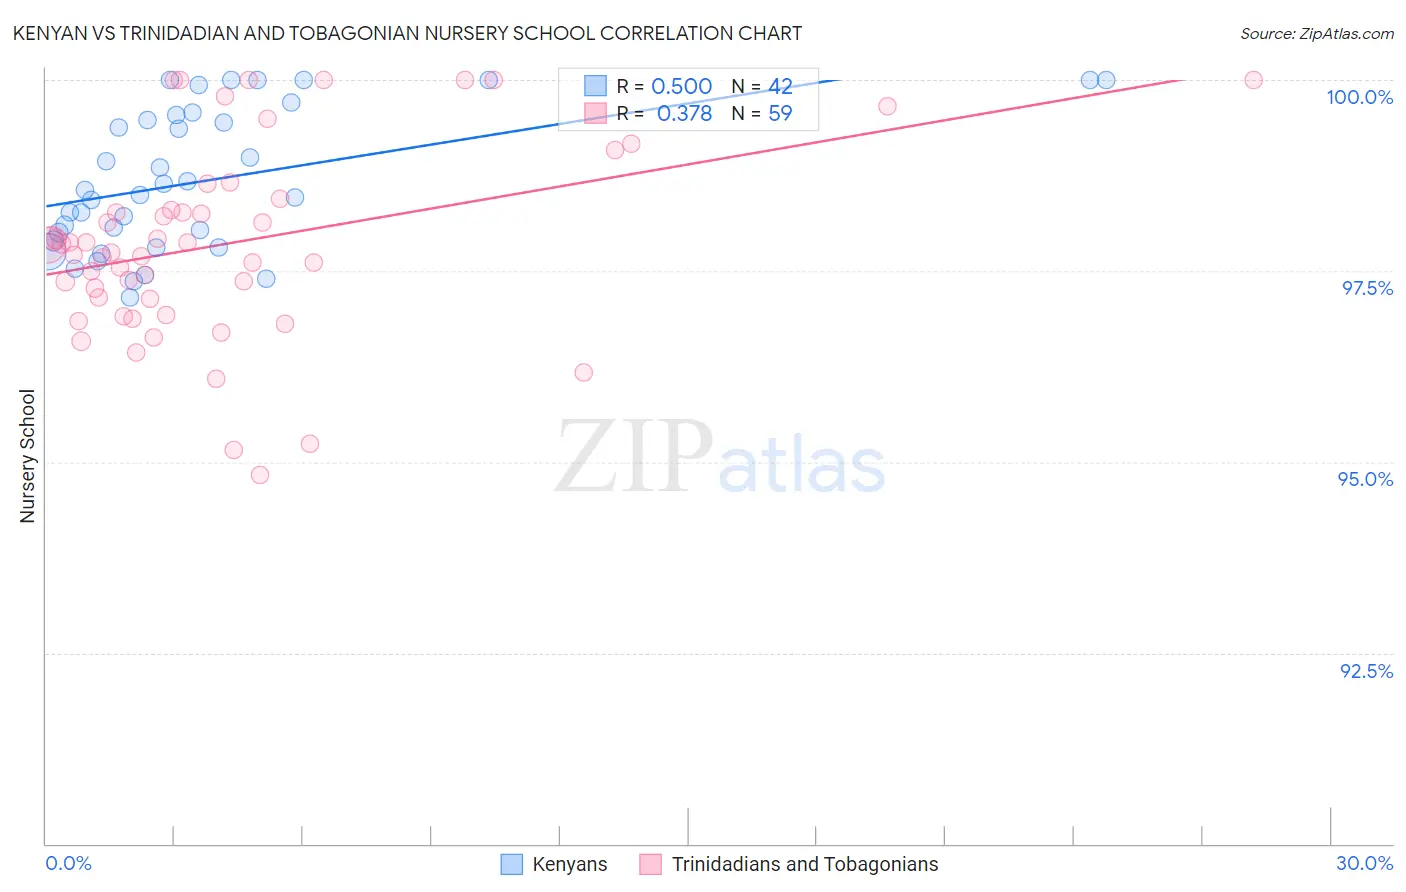
Kenyan vs Trinidadian and Tobagonian Nursery School Correlation Chart
The statistical analysis conducted on geographies consisting of 168,244,481 people shows a substantial positive correlation between the proportion of Kenyans and percentage of population with at least nursery school education in the United States with a correlation coefficient (R) of 0.500 and weighted average of 98.0%. Similarly, the statistical analysis conducted on geographies consisting of 219,882,819 people shows a mild positive correlation between the proportion of Trinidadians and Tobagonians and percentage of population with at least nursery school education in the United States with a correlation coefficient (R) of 0.378 and weighted average of 97.4%, a difference of 0.57%.
Nursery School Correlation Summary
| Measurement | Kenyan | Trinidadian and Tobagonian |
| Minimum | 97.2% | 94.8% |
| Maximum | 100.0% | 100.0% |
| Range | 2.8% | 5.2% |
| Mean | 98.7% | 97.9% |
| Median | 98.5% | 97.8% |
| Interquartile 25% (IQ1) | 97.9% | 97.1% |
| Interquartile 75% (IQ3) | 99.5% | 98.4% |
| Interquartile Range (IQR) | 1.6% | 1.3% |
| Standard Deviation (Sample) | 0.92% | 1.3% |
| Standard Deviation (Population) | 0.91% | 1.2% |
Similar Demographics by Nursery School
Demographics Similar to Kenyans by Nursery School
In terms of nursery school, the demographic groups most similar to Kenyans are Immigrants from Brazil (98.0%, a difference of 0.0%), Navajo (98.0%, a difference of 0.0%), Immigrants from Sri Lanka (98.0%, a difference of 0.0%), Immigrants from Venezuela (98.0%, a difference of 0.0%), and Albanian (98.0%, a difference of 0.0%).
| Demographics | Rating | Rank | Nursery School |
| Spanish Americans | 55.6 /100 | #166 | Average 98.0% |
| Immigrants | Spain | 55.6 /100 | #167 | Average 98.0% |
| Immigrants | Micronesia | 55.0 /100 | #168 | Average 98.0% |
| Immigrants | Korea | 53.8 /100 | #169 | Average 98.0% |
| Bermudans | 53.7 /100 | #170 | Average 98.0% |
| Immigrants | Jordan | 53.4 /100 | #171 | Average 98.0% |
| Immigrants | Brazil | 51.3 /100 | #172 | Average 98.0% |
| Kenyans | 50.2 /100 | #173 | Average 98.0% |
| Navajo | 50.0 /100 | #174 | Average 98.0% |
| Immigrants | Sri Lanka | 49.9 /100 | #175 | Average 98.0% |
| Immigrants | Venezuela | 49.8 /100 | #176 | Average 98.0% |
| Albanians | 48.9 /100 | #177 | Average 98.0% |
| Natives/Alaskans | 48.6 /100 | #178 | Average 98.0% |
| Argentineans | 46.8 /100 | #179 | Average 98.0% |
| Immigrants | Bosnia and Herzegovina | 45.6 /100 | #180 | Average 98.0% |
Demographics Similar to Trinidadians and Tobagonians by Nursery School
In terms of nursery school, the demographic groups most similar to Trinidadians and Tobagonians are Immigrants from Ghana (97.4%, a difference of 0.0%), Barbadian (97.4%, a difference of 0.0%), Afghan (97.4%, a difference of 0.0%), Immigrants from Uzbekistan (97.4%, a difference of 0.010%), and Immigrants from Western Africa (97.4%, a difference of 0.020%).
| Demographics | Rating | Rank | Nursery School |
| Immigrants | Cameroon | 0.1 /100 | #274 | Tragic 97.5% |
| Ghanaians | 0.1 /100 | #275 | Tragic 97.5% |
| Immigrants | Philippines | 0.1 /100 | #276 | Tragic 97.5% |
| Immigrants | Western Africa | 0.1 /100 | #277 | Tragic 97.4% |
| Immigrants | Uzbekistan | 0.1 /100 | #278 | Tragic 97.4% |
| Immigrants | Ghana | 0.1 /100 | #279 | Tragic 97.4% |
| Barbadians | 0.0 /100 | #280 | Tragic 97.4% |
| Trinidadians and Tobagonians | 0.0 /100 | #281 | Tragic 97.4% |
| Afghans | 0.0 /100 | #282 | Tragic 97.4% |
| Immigrants | West Indies | 0.0 /100 | #283 | Tragic 97.4% |
| Immigrants | Trinidad and Tobago | 0.0 /100 | #284 | Tragic 97.4% |
| Immigrants | Barbados | 0.0 /100 | #285 | Tragic 97.4% |
| Immigrants | Portugal | 0.0 /100 | #286 | Tragic 97.4% |
| Immigrants | Hong Kong | 0.0 /100 | #287 | Tragic 97.4% |
| Immigrants | Thailand | 0.0 /100 | #288 | Tragic 97.3% |