Kenyan vs Yugoslavian Married-Couple Family Poverty
COMPARE
Kenyan
Yugoslavian
Married-Couple Family Poverty
Married-Couple Family Poverty Comparison
Kenyans
Yugoslavians
4.8%
MARRIED-COUPLE FAMILY POVERTY
94.7/ 100
METRIC RATING
117th/ 347
METRIC RANK
4.6%
MARRIED-COUPLE FAMILY POVERTY
97.8/ 100
METRIC RATING
101st/ 347
METRIC RANK
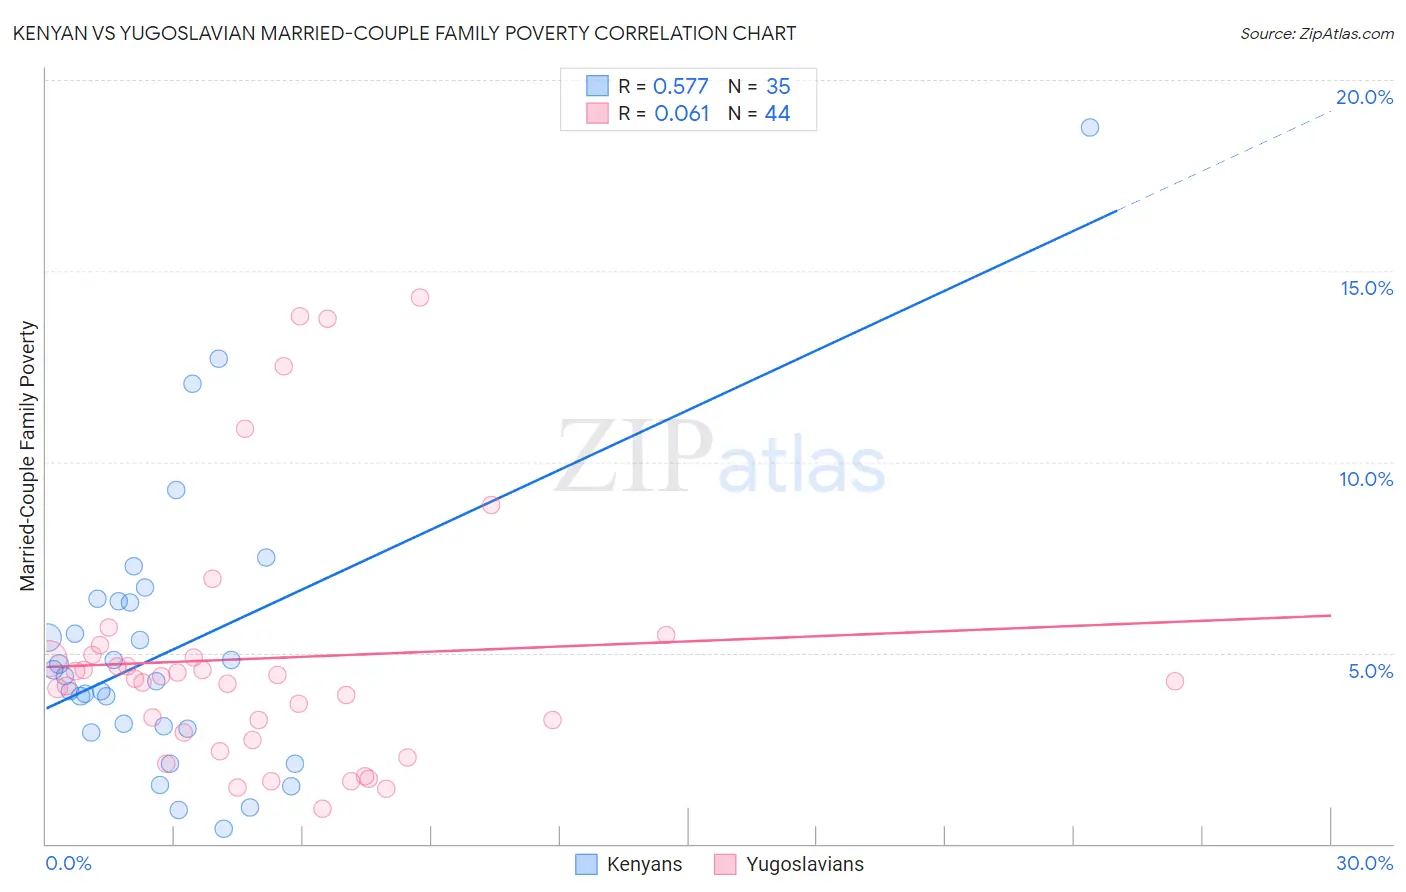
Kenyan vs Yugoslavian Married-Couple Family Poverty Correlation Chart
The statistical analysis conducted on geographies consisting of 167,574,201 people shows a substantial positive correlation between the proportion of Kenyans and poverty level among married-couple families in the United States with a correlation coefficient (R) of 0.577 and weighted average of 4.8%. Similarly, the statistical analysis conducted on geographies consisting of 284,040,939 people shows a slight positive correlation between the proportion of Yugoslavians and poverty level among married-couple families in the United States with a correlation coefficient (R) of 0.061 and weighted average of 4.6%, a difference of 3.1%.
Married-Couple Family Poverty Correlation Summary
| Measurement | Kenyan | Yugoslavian |
| Minimum | 0.40% | 0.92% |
| Maximum | 18.8% | 14.3% |
| Range | 18.3% | 13.4% |
| Mean | 5.1% | 4.9% |
| Median | 4.4% | 4.3% |
| Interquartile 25% (IQ1) | 3.0% | 2.8% |
| Interquartile 75% (IQ3) | 6.3% | 4.9% |
| Interquartile Range (IQR) | 3.3% | 2.1% |
| Standard Deviation (Sample) | 3.7% | 3.4% |
| Standard Deviation (Population) | 3.6% | 3.3% |
Demographics Similar to Kenyans and Yugoslavians by Married-Couple Family Poverty
In terms of married-couple family poverty, the demographic groups most similar to Kenyans are Immigrants from Philippines (4.8%, a difference of 0.020%), Celtic (4.8%, a difference of 0.10%), Taiwanese (4.8%, a difference of 0.11%), Immigrants from Indonesia (4.8%, a difference of 0.26%), and Immigrants from Eastern Asia (4.8%, a difference of 0.39%). Similarly, the demographic groups most similar to Yugoslavians are Immigrants from Western Europe (4.6%, a difference of 0.020%), Immigrants from Europe (4.6%, a difference of 0.13%), Asian (4.7%, a difference of 0.40%), Immigrants from Romania (4.7%, a difference of 0.69%), and Immigrants from Moldova (4.7%, a difference of 1.0%).
| Demographics | Rating | Rank | Married-Couple Family Poverty |
| Immigrants | Europe | 97.9 /100 | #99 | Exceptional 4.6% |
| Immigrants | Western Europe | 97.9 /100 | #100 | Exceptional 4.6% |
| Yugoslavians | 97.8 /100 | #101 | Exceptional 4.6% |
| Asians | 97.6 /100 | #102 | Exceptional 4.7% |
| Immigrants | Romania | 97.3 /100 | #103 | Exceptional 4.7% |
| Immigrants | Moldova | 97.1 /100 | #104 | Exceptional 4.7% |
| Aleuts | 97.0 /100 | #105 | Exceptional 4.7% |
| Immigrants | France | 96.9 /100 | #106 | Exceptional 4.7% |
| Immigrants | Germany | 96.8 /100 | #107 | Exceptional 4.7% |
| Laotians | 96.6 /100 | #108 | Exceptional 4.7% |
| Immigrants | Hong Kong | 96.4 /100 | #109 | Exceptional 4.7% |
| Immigrants | Bolivia | 96.2 /100 | #110 | Exceptional 4.7% |
| Pakistanis | 96.2 /100 | #111 | Exceptional 4.7% |
| Tongans | 95.9 /100 | #112 | Exceptional 4.7% |
| Immigrants | Nepal | 95.9 /100 | #113 | Exceptional 4.7% |
| Immigrants | Indonesia | 95.1 /100 | #114 | Exceptional 4.8% |
| Taiwanese | 94.8 /100 | #115 | Exceptional 4.8% |
| Celtics | 94.8 /100 | #116 | Exceptional 4.8% |
| Kenyans | 94.7 /100 | #117 | Exceptional 4.8% |
| Immigrants | Philippines | 94.6 /100 | #118 | Exceptional 4.8% |
| Immigrants | Eastern Asia | 94.0 /100 | #119 | Exceptional 4.8% |