Indonesian vs Immigrants from Uganda Married-Couple Family Poverty
COMPARE
Indonesian
Immigrants from Uganda
Married-Couple Family Poverty
Married-Couple Family Poverty Comparison
Indonesians
Immigrants from Uganda
6.3%
MARRIED-COUPLE FAMILY POVERTY
0.1/ 100
METRIC RATING
277th/ 347
METRIC RANK
5.2%
MARRIED-COUPLE FAMILY POVERTY
54.9/ 100
METRIC RATING
168th/ 347
METRIC RANK
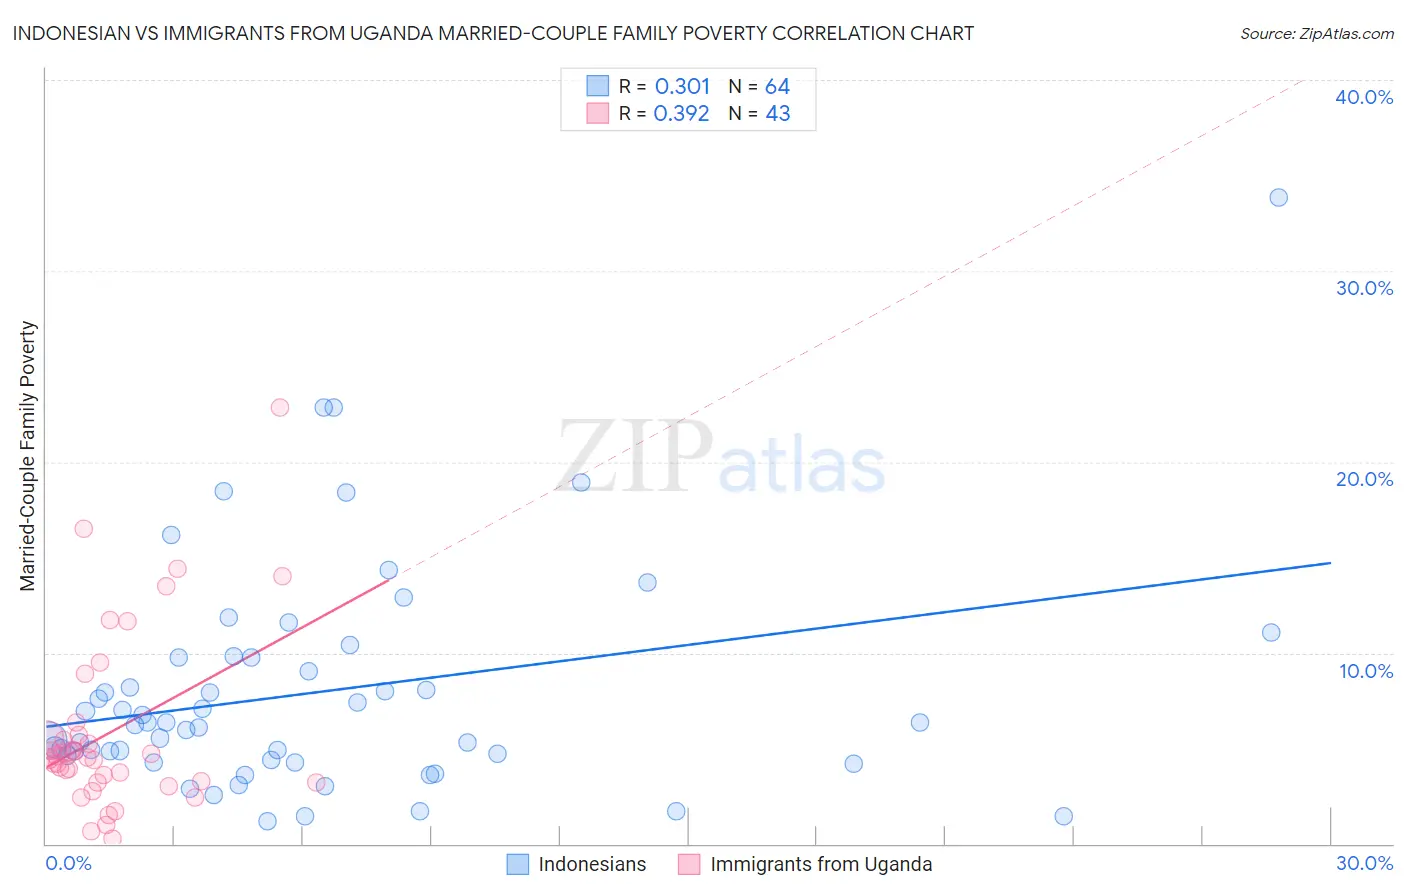
Indonesian vs Immigrants from Uganda Married-Couple Family Poverty Correlation Chart
The statistical analysis conducted on geographies consisting of 162,334,988 people shows a mild positive correlation between the proportion of Indonesians and poverty level among married-couple families in the United States with a correlation coefficient (R) of 0.301 and weighted average of 6.3%. Similarly, the statistical analysis conducted on geographies consisting of 125,662,794 people shows a mild positive correlation between the proportion of Immigrants from Uganda and poverty level among married-couple families in the United States with a correlation coefficient (R) of 0.392 and weighted average of 5.2%, a difference of 22.0%.
Married-Couple Family Poverty Correlation Summary
| Measurement | Indonesian | Immigrants from Uganda |
| Minimum | 1.2% | 0.25% |
| Maximum | 33.8% | 22.9% |
| Range | 32.6% | 22.6% |
| Mean | 7.9% | 5.8% |
| Median | 6.3% | 4.5% |
| Interquartile 25% (IQ1) | 4.5% | 3.2% |
| Interquartile 75% (IQ3) | 9.8% | 5.7% |
| Interquartile Range (IQR) | 5.2% | 2.5% |
| Standard Deviation (Sample) | 6.0% | 4.7% |
| Standard Deviation (Population) | 5.9% | 4.6% |
Similar Demographics by Married-Couple Family Poverty
Demographics Similar to Indonesians by Married-Couple Family Poverty
In terms of married-couple family poverty, the demographic groups most similar to Indonesians are Yaqui (6.3%, a difference of 0.14%), Immigrants from Trinidad and Tobago (6.4%, a difference of 0.48%), Choctaw (6.3%, a difference of 0.59%), Houma (6.4%, a difference of 0.73%), and Barbadian (6.3%, a difference of 0.75%).
| Demographics | Rating | Rank | Married-Couple Family Poverty |
| Immigrants | Jamaica | 0.1 /100 | #270 | Tragic 6.2% |
| Immigrants | Bahamas | 0.1 /100 | #271 | Tragic 6.2% |
| Trinidadians and Tobagonians | 0.1 /100 | #272 | Tragic 6.2% |
| Colville | 0.1 /100 | #273 | Tragic 6.3% |
| Barbadians | 0.1 /100 | #274 | Tragic 6.3% |
| Choctaw | 0.1 /100 | #275 | Tragic 6.3% |
| Yaqui | 0.1 /100 | #276 | Tragic 6.3% |
| Indonesians | 0.1 /100 | #277 | Tragic 6.3% |
| Immigrants | Trinidad and Tobago | 0.1 /100 | #278 | Tragic 6.4% |
| Houma | 0.0 /100 | #279 | Tragic 6.4% |
| West Indians | 0.0 /100 | #280 | Tragic 6.4% |
| Mexican American Indians | 0.0 /100 | #281 | Tragic 6.4% |
| Seminole | 0.0 /100 | #282 | Tragic 6.4% |
| Ute | 0.0 /100 | #283 | Tragic 6.4% |
| Dutch West Indians | 0.0 /100 | #284 | Tragic 6.4% |
Demographics Similar to Immigrants from Uganda by Married-Couple Family Poverty
In terms of married-couple family poverty, the demographic groups most similar to Immigrants from Uganda are Ottawa (5.2%, a difference of 0.040%), Immigrants from Argentina (5.2%, a difference of 0.060%), Bermudan (5.2%, a difference of 0.23%), Immigrants from Northern Africa (5.2%, a difference of 0.41%), and Alsatian (5.2%, a difference of 0.43%).
| Demographics | Rating | Rank | Married-Couple Family Poverty |
| Ethiopians | 68.1 /100 | #161 | Good 5.1% |
| Immigrants | Jordan | 66.5 /100 | #162 | Good 5.1% |
| Sierra Leoneans | 64.1 /100 | #163 | Good 5.1% |
| Hawaiians | 62.3 /100 | #164 | Good 5.1% |
| Immigrants | Malaysia | 62.2 /100 | #165 | Good 5.1% |
| Paraguayans | 61.5 /100 | #166 | Good 5.1% |
| Costa Ricans | 61.5 /100 | #167 | Good 5.1% |
| Immigrants | Uganda | 54.9 /100 | #168 | Average 5.2% |
| Ottawa | 54.5 /100 | #169 | Average 5.2% |
| Immigrants | Argentina | 54.4 /100 | #170 | Average 5.2% |
| Bermudans | 52.9 /100 | #171 | Average 5.2% |
| Immigrants | Northern Africa | 51.3 /100 | #172 | Average 5.2% |
| Alsatians | 51.2 /100 | #173 | Average 5.2% |
| Immigrants | Eastern Africa | 50.0 /100 | #174 | Average 5.2% |
| Marshallese | 47.9 /100 | #175 | Average 5.2% |