Indonesian vs Immigrants from Uganda Child Poverty Under the Age of 16
COMPARE
Indonesian
Immigrants from Uganda
Child Poverty Under the Age of 16
Child Poverty Under the Age of 16 Comparison
Indonesians
Immigrants from Uganda
21.0%
CHILD POVERTY UNDER THE AGE OF 16
0.0/ 100
METRIC RATING
300th/ 347
METRIC RANK
16.8%
CHILD POVERTY UNDER THE AGE OF 16
22.5/ 100
METRIC RATING
195th/ 347
METRIC RANK
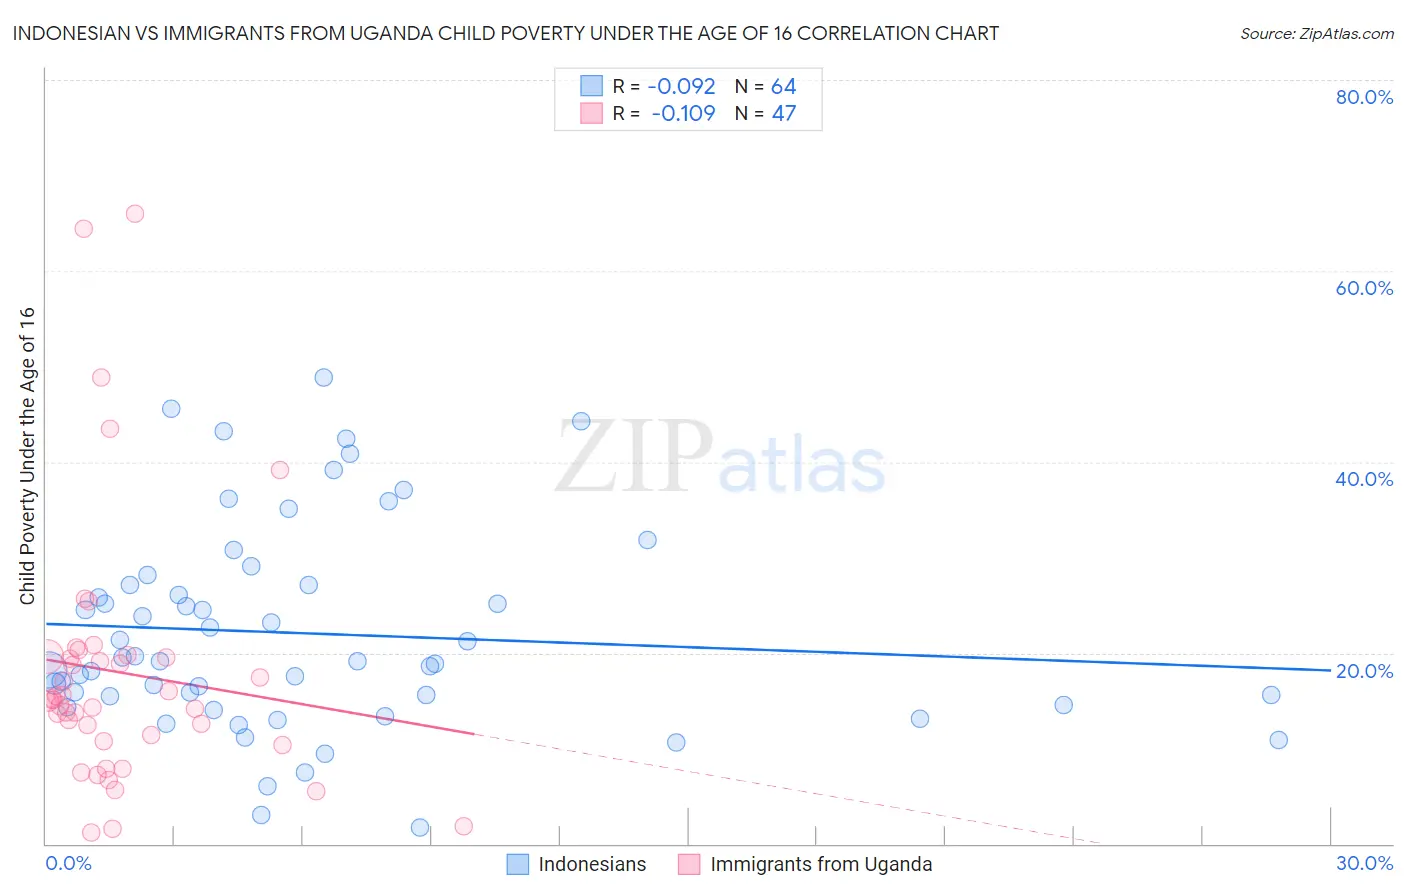
Indonesian vs Immigrants from Uganda Child Poverty Under the Age of 16 Correlation Chart
The statistical analysis conducted on geographies consisting of 162,203,177 people shows a slight negative correlation between the proportion of Indonesians and poverty level among children under the age of 16 in the United States with a correlation coefficient (R) of -0.092 and weighted average of 21.0%. Similarly, the statistical analysis conducted on geographies consisting of 125,688,458 people shows a poor negative correlation between the proportion of Immigrants from Uganda and poverty level among children under the age of 16 in the United States with a correlation coefficient (R) of -0.109 and weighted average of 16.8%, a difference of 24.7%.
Child Poverty Under the Age of 16 Correlation Summary
| Measurement | Indonesian | Immigrants from Uganda |
| Minimum | 1.7% | 1.2% |
| Maximum | 48.9% | 66.0% |
| Range | 47.2% | 64.8% |
| Mean | 22.0% | 17.9% |
| Median | 19.1% | 15.1% |
| Interquartile 25% (IQ1) | 15.0% | 10.7% |
| Interquartile 75% (IQ3) | 27.1% | 19.6% |
| Interquartile Range (IQR) | 12.1% | 8.9% |
| Standard Deviation (Sample) | 10.7% | 13.8% |
| Standard Deviation (Population) | 10.7% | 13.6% |
Similar Demographics by Child Poverty Under the Age of 16
Demographics Similar to Indonesians by Child Poverty Under the Age of 16
In terms of child poverty under the age of 16, the demographic groups most similar to Indonesians are Immigrants from Grenada (21.0%, a difference of 0.040%), Immigrants from Bahamas (21.0%, a difference of 0.28%), Choctaw (21.0%, a difference of 0.32%), Somali (21.0%, a difference of 0.37%), and Immigrants from Haiti (20.9%, a difference of 0.49%).
| Demographics | Rating | Rank | Child Poverty Under the Age of 16 |
| Immigrants | Senegal | 0.0 /100 | #293 | Tragic 20.6% |
| Haitians | 0.0 /100 | #294 | Tragic 20.7% |
| Mexicans | 0.0 /100 | #295 | Tragic 20.7% |
| Immigrants | Caribbean | 0.0 /100 | #296 | Tragic 20.8% |
| Hispanics or Latinos | 0.0 /100 | #297 | Tragic 20.8% |
| Arapaho | 0.0 /100 | #298 | Tragic 20.8% |
| Immigrants | Haiti | 0.0 /100 | #299 | Tragic 20.9% |
| Indonesians | 0.0 /100 | #300 | Tragic 21.0% |
| Immigrants | Grenada | 0.0 /100 | #301 | Tragic 21.0% |
| Immigrants | Bahamas | 0.0 /100 | #302 | Tragic 21.0% |
| Choctaw | 0.0 /100 | #303 | Tragic 21.0% |
| Somalis | 0.0 /100 | #304 | Tragic 21.0% |
| Seminole | 0.0 /100 | #305 | Tragic 21.1% |
| Guatemalans | 0.0 /100 | #306 | Tragic 21.2% |
| Immigrants | Central America | 0.0 /100 | #307 | Tragic 21.3% |
Demographics Similar to Immigrants from Uganda by Child Poverty Under the Age of 16
In terms of child poverty under the age of 16, the demographic groups most similar to Immigrants from Uganda are Immigrants from Lebanon (16.8%, a difference of 0.080%), Immigrants from Uruguay (16.8%, a difference of 0.090%), Spaniard (16.8%, a difference of 0.11%), Spanish (16.7%, a difference of 0.31%), and Immigrants from Kenya (16.9%, a difference of 0.60%).
| Demographics | Rating | Rank | Child Poverty Under the Age of 16 |
| Immigrants | Morocco | 31.2 /100 | #188 | Fair 16.6% |
| Immigrants | Portugal | 30.0 /100 | #189 | Fair 16.6% |
| Immigrants | Costa Rica | 29.6 /100 | #190 | Fair 16.6% |
| Immigrants | Iraq | 28.3 /100 | #191 | Fair 16.7% |
| Spanish | 24.5 /100 | #192 | Fair 16.7% |
| Spaniards | 23.2 /100 | #193 | Fair 16.8% |
| Immigrants | Uruguay | 23.1 /100 | #194 | Fair 16.8% |
| Immigrants | Uganda | 22.5 /100 | #195 | Fair 16.8% |
| Immigrants | Lebanon | 22.0 /100 | #196 | Fair 16.8% |
| Immigrants | Kenya | 19.1 /100 | #197 | Poor 16.9% |
| Delaware | 17.1 /100 | #198 | Poor 17.0% |
| Immigrants | Afghanistan | 15.1 /100 | #199 | Poor 17.0% |
| Immigrants | Cameroon | 14.7 /100 | #200 | Poor 17.1% |
| Immigrants | Uzbekistan | 14.7 /100 | #201 | Poor 17.1% |
| Ugandans | 14.3 /100 | #202 | Poor 17.1% |