Indonesian vs Immigrants from Latin America Married-Couple Family Poverty
COMPARE
Indonesian
Immigrants from Latin America
Married-Couple Family Poverty
Married-Couple Family Poverty Comparison
Indonesians
Immigrants from Latin America
6.3%
MARRIED-COUPLE FAMILY POVERTY
0.1/ 100
METRIC RATING
277th/ 347
METRIC RANK
7.2%
MARRIED-COUPLE FAMILY POVERTY
0.0/ 100
METRIC RATING
319th/ 347
METRIC RANK
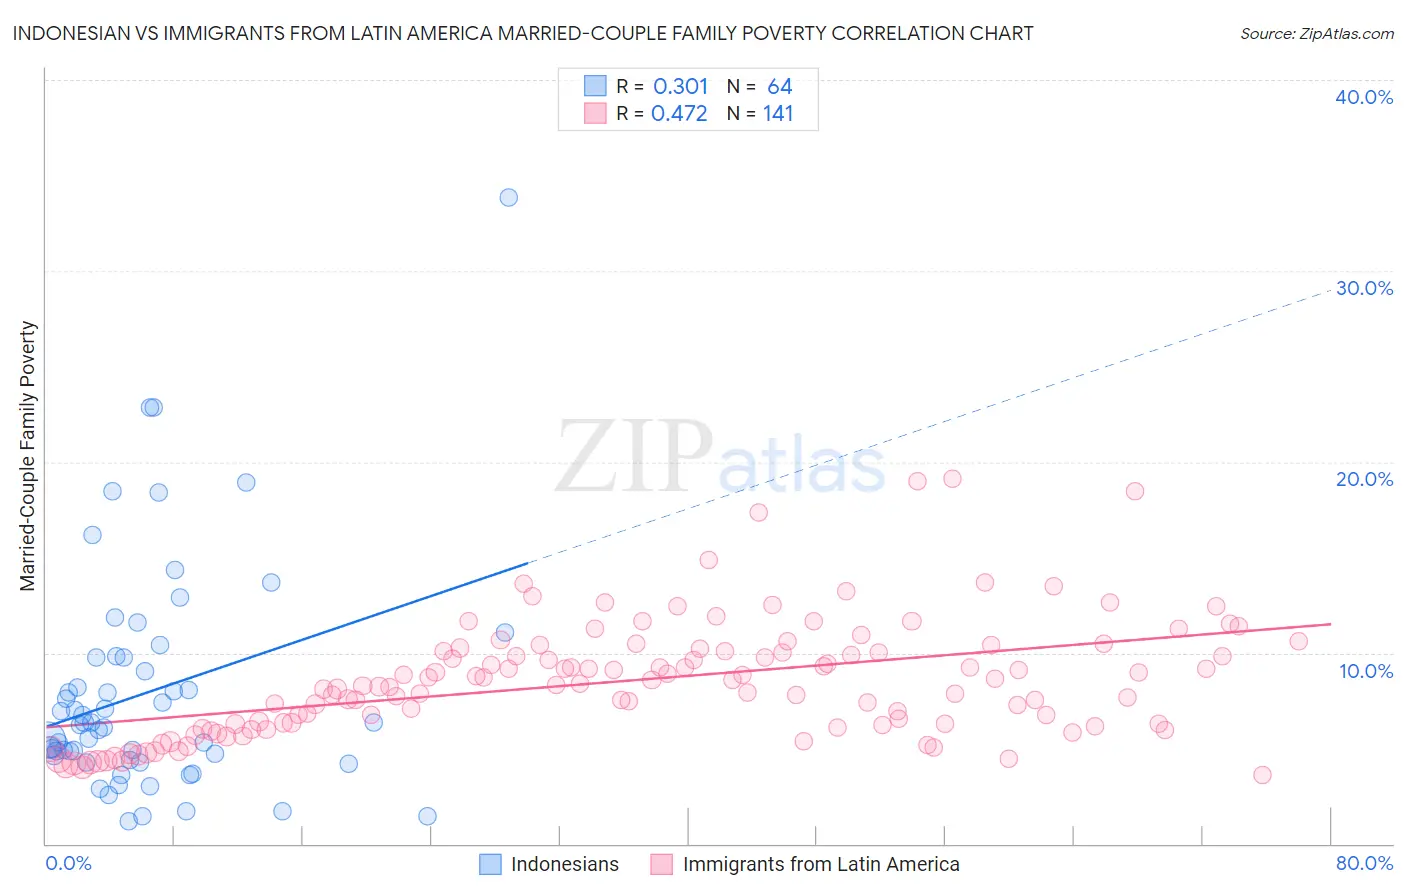
Indonesian vs Immigrants from Latin America Married-Couple Family Poverty Correlation Chart
The statistical analysis conducted on geographies consisting of 162,334,988 people shows a mild positive correlation between the proportion of Indonesians and poverty level among married-couple families in the United States with a correlation coefficient (R) of 0.301 and weighted average of 6.3%. Similarly, the statistical analysis conducted on geographies consisting of 546,700,324 people shows a moderate positive correlation between the proportion of Immigrants from Latin America and poverty level among married-couple families in the United States with a correlation coefficient (R) of 0.472 and weighted average of 7.2%, a difference of 13.8%.
Married-Couple Family Poverty Correlation Summary
| Measurement | Indonesian | Immigrants from Latin America |
| Minimum | 1.2% | 3.6% |
| Maximum | 33.8% | 19.1% |
| Range | 32.6% | 15.5% |
| Mean | 7.9% | 8.5% |
| Median | 6.3% | 8.3% |
| Interquartile 25% (IQ1) | 4.5% | 6.2% |
| Interquartile 75% (IQ3) | 9.8% | 10.1% |
| Interquartile Range (IQR) | 5.2% | 3.9% |
| Standard Deviation (Sample) | 6.0% | 3.0% |
| Standard Deviation (Population) | 5.9% | 3.0% |
Similar Demographics by Married-Couple Family Poverty
Demographics Similar to Indonesians by Married-Couple Family Poverty
In terms of married-couple family poverty, the demographic groups most similar to Indonesians are Yaqui (6.3%, a difference of 0.14%), Immigrants from Trinidad and Tobago (6.4%, a difference of 0.48%), Choctaw (6.3%, a difference of 0.59%), Houma (6.4%, a difference of 0.73%), and Barbadian (6.3%, a difference of 0.75%).
| Demographics | Rating | Rank | Married-Couple Family Poverty |
| Immigrants | Jamaica | 0.1 /100 | #270 | Tragic 6.2% |
| Immigrants | Bahamas | 0.1 /100 | #271 | Tragic 6.2% |
| Trinidadians and Tobagonians | 0.1 /100 | #272 | Tragic 6.2% |
| Colville | 0.1 /100 | #273 | Tragic 6.3% |
| Barbadians | 0.1 /100 | #274 | Tragic 6.3% |
| Choctaw | 0.1 /100 | #275 | Tragic 6.3% |
| Yaqui | 0.1 /100 | #276 | Tragic 6.3% |
| Indonesians | 0.1 /100 | #277 | Tragic 6.3% |
| Immigrants | Trinidad and Tobago | 0.1 /100 | #278 | Tragic 6.4% |
| Houma | 0.0 /100 | #279 | Tragic 6.4% |
| West Indians | 0.0 /100 | #280 | Tragic 6.4% |
| Mexican American Indians | 0.0 /100 | #281 | Tragic 6.4% |
| Seminole | 0.0 /100 | #282 | Tragic 6.4% |
| Ute | 0.0 /100 | #283 | Tragic 6.4% |
| Dutch West Indians | 0.0 /100 | #284 | Tragic 6.4% |
Demographics Similar to Immigrants from Latin America by Married-Couple Family Poverty
In terms of married-couple family poverty, the demographic groups most similar to Immigrants from Latin America are Immigrants from Guatemala (7.2%, a difference of 0.17%), Mexican (7.2%, a difference of 0.34%), Honduran (7.2%, a difference of 0.65%), Inupiat (7.1%, a difference of 0.81%), and British West Indian (7.1%, a difference of 1.1%).
| Demographics | Rating | Rank | Married-Couple Family Poverty |
| Immigrants | Armenia | 0.0 /100 | #312 | Tragic 7.1% |
| Immigrants | St. Vincent and the Grenadines | 0.0 /100 | #313 | Tragic 7.1% |
| British West Indians | 0.0 /100 | #314 | Tragic 7.1% |
| Inupiat | 0.0 /100 | #315 | Tragic 7.1% |
| Hondurans | 0.0 /100 | #316 | Tragic 7.2% |
| Mexicans | 0.0 /100 | #317 | Tragic 7.2% |
| Immigrants | Guatemala | 0.0 /100 | #318 | Tragic 7.2% |
| Immigrants | Latin America | 0.0 /100 | #319 | Tragic 7.2% |
| Immigrants | Grenada | 0.0 /100 | #320 | Tragic 7.3% |
| Immigrants | Caribbean | 0.0 /100 | #321 | Tragic 7.3% |
| Immigrants | Honduras | 0.0 /100 | #322 | Tragic 7.3% |
| Vietnamese | 0.0 /100 | #323 | Tragic 7.4% |
| Immigrants | Central America | 0.0 /100 | #324 | Tragic 7.4% |
| Immigrants | Cuba | 0.0 /100 | #325 | Tragic 7.5% |
| Immigrants | Bangladesh | 0.0 /100 | #326 | Tragic 7.5% |