Indonesian vs Bangladeshi Married-Couple Family Poverty
COMPARE
Indonesian
Bangladeshi
Married-Couple Family Poverty
Married-Couple Family Poverty Comparison
Indonesians
Bangladeshis
6.3%
MARRIED-COUPLE FAMILY POVERTY
0.1/ 100
METRIC RATING
277th/ 347
METRIC RANK
6.0%
MARRIED-COUPLE FAMILY POVERTY
0.5/ 100
METRIC RATING
256th/ 347
METRIC RANK
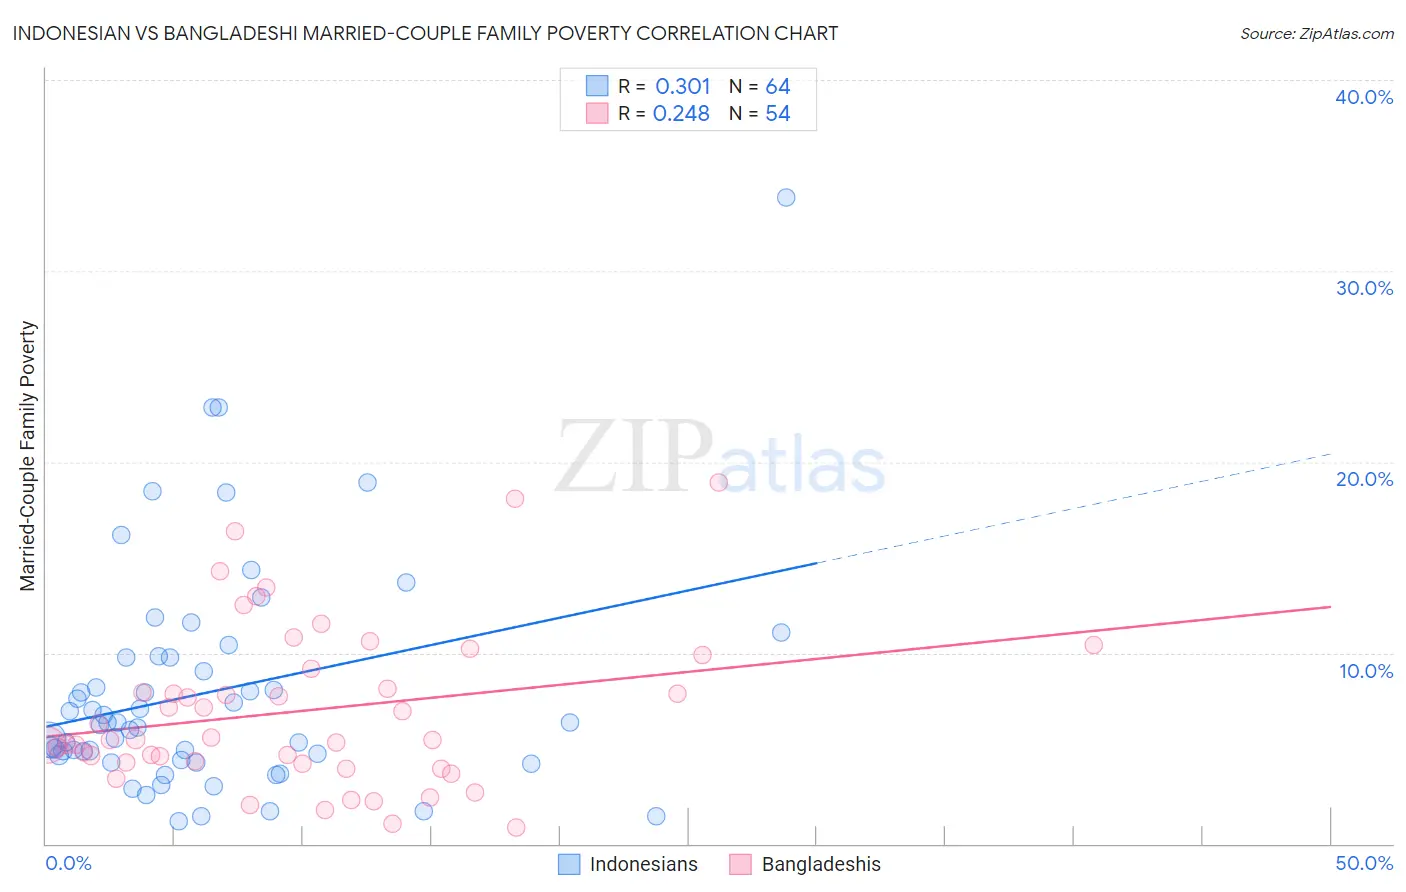
Indonesian vs Bangladeshi Married-Couple Family Poverty Correlation Chart
The statistical analysis conducted on geographies consisting of 162,334,988 people shows a mild positive correlation between the proportion of Indonesians and poverty level among married-couple families in the United States with a correlation coefficient (R) of 0.301 and weighted average of 6.3%. Similarly, the statistical analysis conducted on geographies consisting of 140,885,862 people shows a weak positive correlation between the proportion of Bangladeshis and poverty level among married-couple families in the United States with a correlation coefficient (R) of 0.248 and weighted average of 6.0%, a difference of 5.4%.
Married-Couple Family Poverty Correlation Summary
| Measurement | Indonesian | Bangladeshi |
| Minimum | 1.2% | 0.85% |
| Maximum | 33.8% | 18.9% |
| Range | 32.6% | 18.1% |
| Mean | 7.9% | 7.0% |
| Median | 6.3% | 5.4% |
| Interquartile 25% (IQ1) | 4.5% | 4.3% |
| Interquartile 75% (IQ3) | 9.8% | 9.1% |
| Interquartile Range (IQR) | 5.2% | 4.9% |
| Standard Deviation (Sample) | 6.0% | 4.2% |
| Standard Deviation (Population) | 5.9% | 4.2% |
Similar Demographics by Married-Couple Family Poverty
Demographics Similar to Indonesians by Married-Couple Family Poverty
In terms of married-couple family poverty, the demographic groups most similar to Indonesians are Yaqui (6.3%, a difference of 0.14%), Immigrants from Trinidad and Tobago (6.4%, a difference of 0.48%), Choctaw (6.3%, a difference of 0.59%), Houma (6.4%, a difference of 0.73%), and Barbadian (6.3%, a difference of 0.75%).
| Demographics | Rating | Rank | Married-Couple Family Poverty |
| Immigrants | Jamaica | 0.1 /100 | #270 | Tragic 6.2% |
| Immigrants | Bahamas | 0.1 /100 | #271 | Tragic 6.2% |
| Trinidadians and Tobagonians | 0.1 /100 | #272 | Tragic 6.2% |
| Colville | 0.1 /100 | #273 | Tragic 6.3% |
| Barbadians | 0.1 /100 | #274 | Tragic 6.3% |
| Choctaw | 0.1 /100 | #275 | Tragic 6.3% |
| Yaqui | 0.1 /100 | #276 | Tragic 6.3% |
| Indonesians | 0.1 /100 | #277 | Tragic 6.3% |
| Immigrants | Trinidad and Tobago | 0.1 /100 | #278 | Tragic 6.4% |
| Houma | 0.0 /100 | #279 | Tragic 6.4% |
| West Indians | 0.0 /100 | #280 | Tragic 6.4% |
| Mexican American Indians | 0.0 /100 | #281 | Tragic 6.4% |
| Seminole | 0.0 /100 | #282 | Tragic 6.4% |
| Ute | 0.0 /100 | #283 | Tragic 6.4% |
| Dutch West Indians | 0.0 /100 | #284 | Tragic 6.4% |
Demographics Similar to Bangladeshis by Married-Couple Family Poverty
In terms of married-couple family poverty, the demographic groups most similar to Bangladeshis are Immigrants from Burma/Myanmar (6.0%, a difference of 0.24%), Immigrants (6.0%, a difference of 0.37%), Comanche (6.0%, a difference of 0.50%), Immigrants from Somalia (6.0%, a difference of 0.65%), and African (6.0%, a difference of 0.71%).
| Demographics | Rating | Rank | Married-Couple Family Poverty |
| Tsimshian | 1.1 /100 | #249 | Tragic 5.9% |
| Immigrants | Eritrea | 1.1 /100 | #250 | Tragic 5.9% |
| Immigrants | Ghana | 1.0 /100 | #251 | Tragic 5.9% |
| Immigrants | Western Asia | 0.7 /100 | #252 | Tragic 6.0% |
| Africans | 0.7 /100 | #253 | Tragic 6.0% |
| Immigrants | Somalia | 0.7 /100 | #254 | Tragic 6.0% |
| Comanche | 0.7 /100 | #255 | Tragic 6.0% |
| Bangladeshis | 0.5 /100 | #256 | Tragic 6.0% |
| Immigrants | Burma/Myanmar | 0.5 /100 | #257 | Tragic 6.0% |
| Immigrants | Immigrants | 0.5 /100 | #258 | Tragic 6.0% |
| Alaskan Athabascans | 0.4 /100 | #259 | Tragic 6.1% |
| Jamaicans | 0.3 /100 | #260 | Tragic 6.1% |
| Senegalese | 0.3 /100 | #261 | Tragic 6.1% |
| Shoshone | 0.3 /100 | #262 | Tragic 6.1% |
| Immigrants | Senegal | 0.3 /100 | #263 | Tragic 6.1% |