Immigrants from Turkey vs Immigrants from Greece Single Male Poverty
COMPARE
Immigrants from Turkey
Immigrants from Greece
Single Male Poverty
Single Male Poverty Comparison
Immigrants from Turkey
Immigrants from Greece
12.1%
SINGLE MALE POVERTY
98.2/ 100
METRIC RATING
91st/ 347
METRIC RANK
11.9%
SINGLE MALE POVERTY
99.6/ 100
METRIC RATING
71st/ 347
METRIC RANK
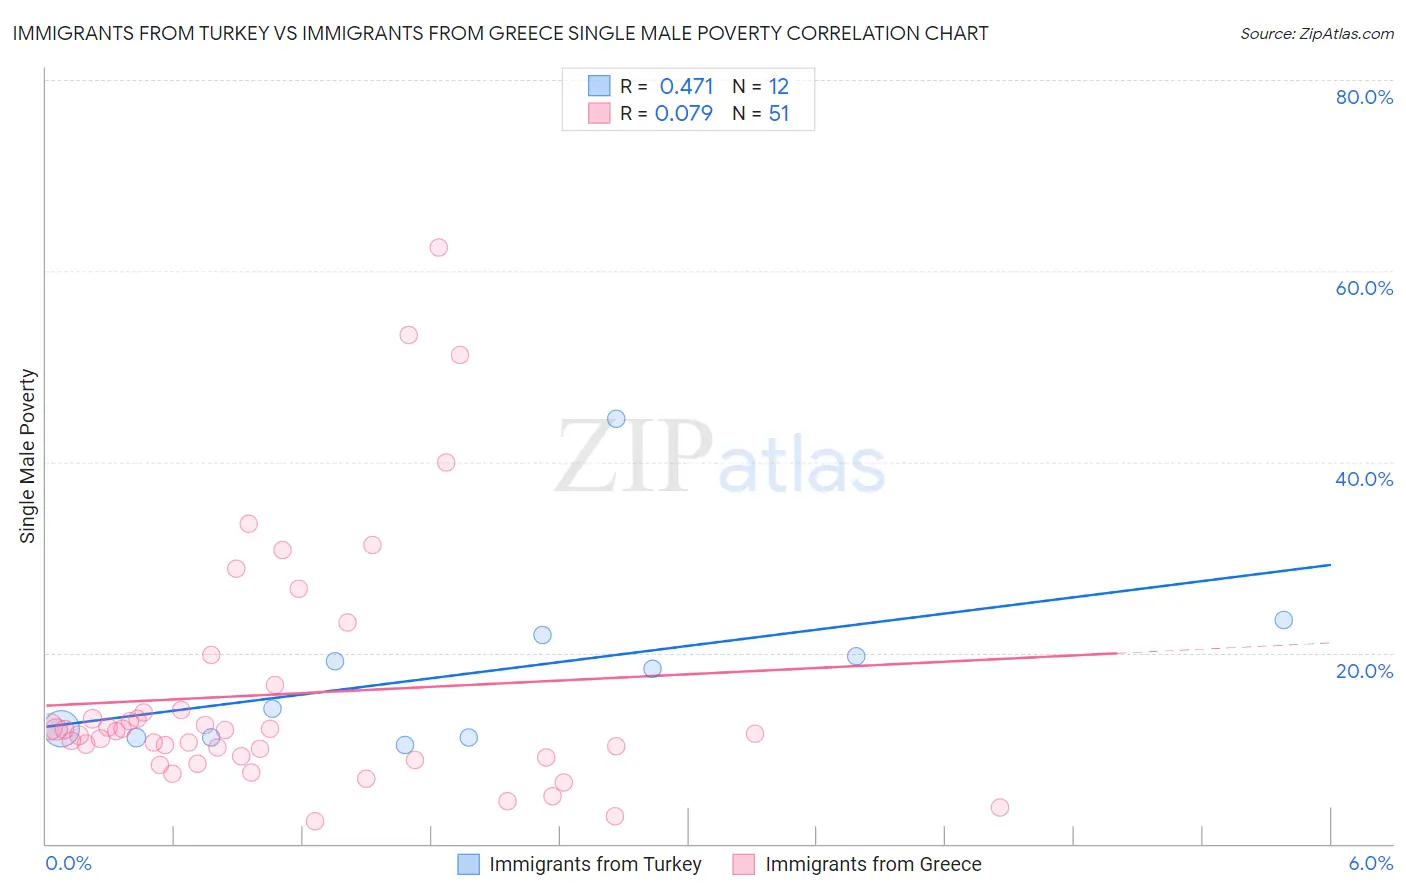
Immigrants from Turkey vs Immigrants from Greece Single Male Poverty Correlation Chart
The statistical analysis conducted on geographies consisting of 203,227,813 people shows a moderate positive correlation between the proportion of Immigrants from Turkey and poverty level among single males in the United States with a correlation coefficient (R) of 0.471 and weighted average of 12.1%. Similarly, the statistical analysis conducted on geographies consisting of 196,065,310 people shows a slight positive correlation between the proportion of Immigrants from Greece and poverty level among single males in the United States with a correlation coefficient (R) of 0.079 and weighted average of 11.9%, a difference of 2.1%.
Single Male Poverty Correlation Summary
| Measurement | Immigrants from Turkey | Immigrants from Greece |
| Minimum | 10.3% | 2.4% |
| Maximum | 44.5% | 62.5% |
| Range | 34.2% | 60.1% |
| Mean | 18.1% | 15.7% |
| Median | 16.2% | 11.7% |
| Interquartile 25% (IQ1) | 11.1% | 9.1% |
| Interquartile 75% (IQ3) | 20.8% | 14.0% |
| Interquartile Range (IQR) | 9.6% | 4.9% |
| Standard Deviation (Sample) | 9.5% | 12.9% |
| Standard Deviation (Population) | 9.1% | 12.8% |
Demographics Similar to Immigrants from Turkey and Immigrants from Greece by Single Male Poverty
In terms of single male poverty, the demographic groups most similar to Immigrants from Turkey are South American Indian (12.1%, a difference of 0.050%), Immigrants from Ireland (12.1%, a difference of 0.060%), Immigrants from Eritrea (12.1%, a difference of 0.23%), South American (12.1%, a difference of 0.24%), and Immigrants from Israel (12.1%, a difference of 0.25%). Similarly, the demographic groups most similar to Immigrants from Greece are Immigrants from Argentina (11.9%, a difference of 0.18%), Argentinean (11.9%, a difference of 0.31%), Chilean (11.9%, a difference of 0.36%), Uruguayan (11.9%, a difference of 0.56%), and Immigrants from Northern Africa (11.9%, a difference of 0.58%).
| Demographics | Rating | Rank | Single Male Poverty |
| Immigrants | Greece | 99.6 /100 | #71 | Exceptional 11.9% |
| Immigrants | Argentina | 99.5 /100 | #72 | Exceptional 11.9% |
| Argentineans | 99.5 /100 | #73 | Exceptional 11.9% |
| Chileans | 99.5 /100 | #74 | Exceptional 11.9% |
| Uruguayans | 99.4 /100 | #75 | Exceptional 11.9% |
| Immigrants | Northern Africa | 99.4 /100 | #76 | Exceptional 11.9% |
| Immigrants | Malaysia | 99.2 /100 | #77 | Exceptional 12.0% |
| Immigrants | Venezuela | 99.1 /100 | #78 | Exceptional 12.0% |
| Immigrants | Belgium | 99.0 /100 | #79 | Exceptional 12.0% |
| Armenians | 98.7 /100 | #80 | Exceptional 12.1% |
| Immigrants | South America | 98.7 /100 | #81 | Exceptional 12.1% |
| Immigrants | Colombia | 98.6 /100 | #82 | Exceptional 12.1% |
| Immigrants | Chile | 98.6 /100 | #83 | Exceptional 12.1% |
| Immigrants | Czechoslovakia | 98.6 /100 | #84 | Exceptional 12.1% |
| Turks | 98.5 /100 | #85 | Exceptional 12.1% |
| Immigrants | Israel | 98.5 /100 | #86 | Exceptional 12.1% |
| South Americans | 98.5 /100 | #87 | Exceptional 12.1% |
| Immigrants | Eritrea | 98.5 /100 | #88 | Exceptional 12.1% |
| Immigrants | Ireland | 98.3 /100 | #89 | Exceptional 12.1% |
| South American Indians | 98.3 /100 | #90 | Exceptional 12.1% |
| Immigrants | Turkey | 98.2 /100 | #91 | Exceptional 12.1% |