Immigrants from Turkey vs Armenian Single Male Poverty
COMPARE
Immigrants from Turkey
Armenian
Single Male Poverty
Single Male Poverty Comparison
Immigrants from Turkey
Armenians
12.1%
SINGLE MALE POVERTY
98.2/ 100
METRIC RATING
91st/ 347
METRIC RANK
12.1%
SINGLE MALE POVERTY
98.7/ 100
METRIC RATING
80th/ 347
METRIC RANK
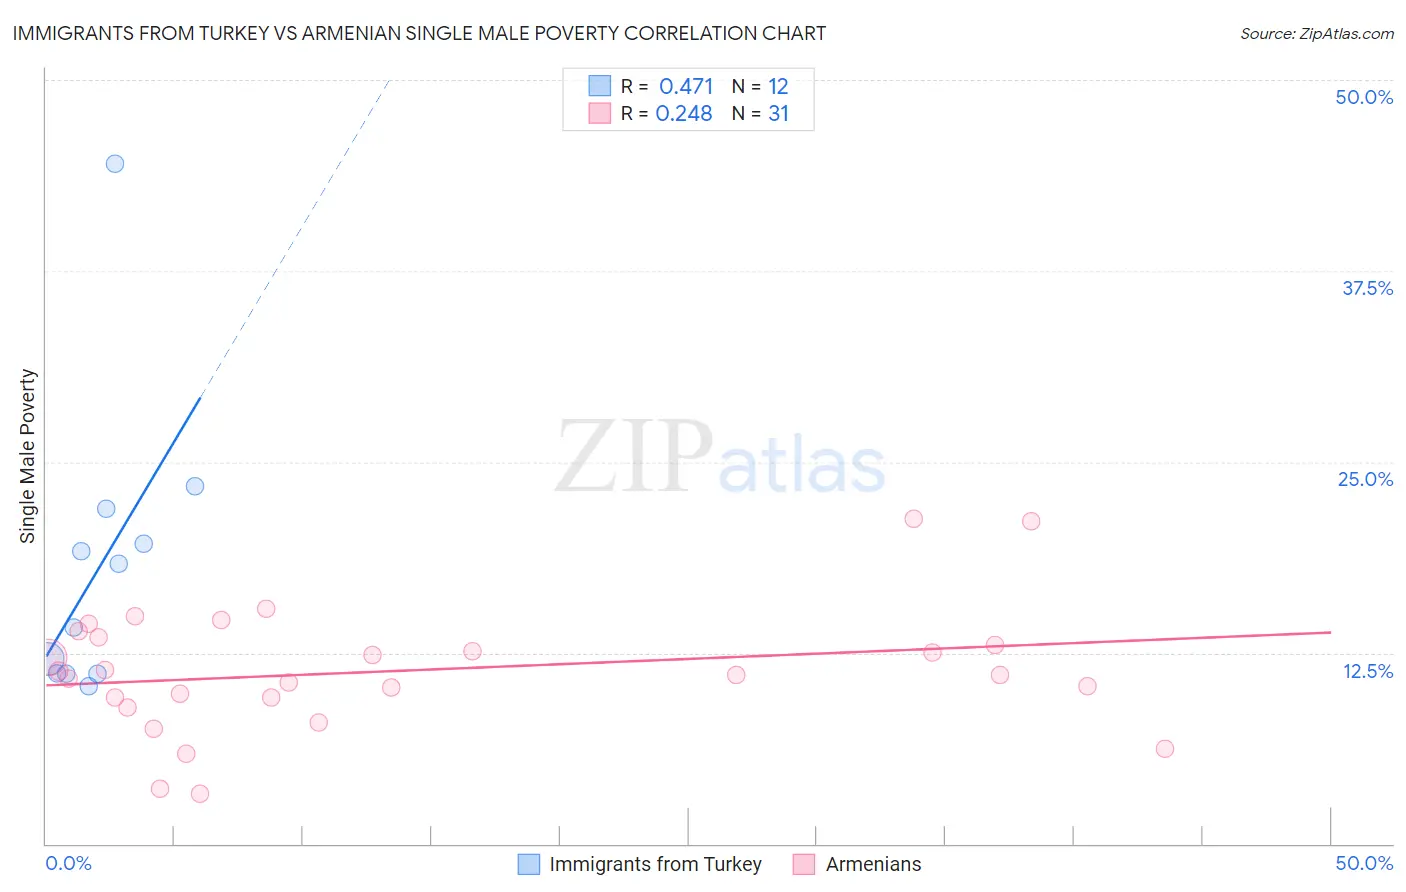
Immigrants from Turkey vs Armenian Single Male Poverty Correlation Chart
The statistical analysis conducted on geographies consisting of 203,227,813 people shows a moderate positive correlation between the proportion of Immigrants from Turkey and poverty level among single males in the United States with a correlation coefficient (R) of 0.471 and weighted average of 12.1%. Similarly, the statistical analysis conducted on geographies consisting of 275,861,464 people shows a weak positive correlation between the proportion of Armenians and poverty level among single males in the United States with a correlation coefficient (R) of 0.248 and weighted average of 12.1%, a difference of 0.45%.
Single Male Poverty Correlation Summary
| Measurement | Immigrants from Turkey | Armenian |
| Minimum | 10.3% | 3.3% |
| Maximum | 44.5% | 21.2% |
| Range | 34.2% | 17.9% |
| Mean | 18.1% | 11.3% |
| Median | 16.2% | 11.1% |
| Interquartile 25% (IQ1) | 11.1% | 9.5% |
| Interquartile 75% (IQ3) | 20.8% | 13.5% |
| Interquartile Range (IQR) | 9.6% | 4.0% |
| Standard Deviation (Sample) | 9.5% | 4.0% |
| Standard Deviation (Population) | 9.1% | 4.0% |
Demographics Similar to Immigrants from Turkey and Armenians by Single Male Poverty
In terms of single male poverty, the demographic groups most similar to Immigrants from Turkey are South American Indian (12.1%, a difference of 0.050%), Immigrants from Ireland (12.1%, a difference of 0.060%), Spanish American Indian (12.1%, a difference of 0.11%), Immigrants from Bosnia and Herzegovina (12.1%, a difference of 0.17%), and Immigrants from Eritrea (12.1%, a difference of 0.23%). Similarly, the demographic groups most similar to Armenians are Immigrants from South America (12.1%, a difference of 0.020%), Immigrants from Colombia (12.1%, a difference of 0.080%), Immigrants from Chile (12.1%, a difference of 0.080%), Immigrants from Czechoslovakia (12.1%, a difference of 0.11%), and Turkish (12.1%, a difference of 0.18%).
| Demographics | Rating | Rank | Single Male Poverty |
| Uruguayans | 99.4 /100 | #75 | Exceptional 11.9% |
| Immigrants | Northern Africa | 99.4 /100 | #76 | Exceptional 11.9% |
| Immigrants | Malaysia | 99.2 /100 | #77 | Exceptional 12.0% |
| Immigrants | Venezuela | 99.1 /100 | #78 | Exceptional 12.0% |
| Immigrants | Belgium | 99.0 /100 | #79 | Exceptional 12.0% |
| Armenians | 98.7 /100 | #80 | Exceptional 12.1% |
| Immigrants | South America | 98.7 /100 | #81 | Exceptional 12.1% |
| Immigrants | Colombia | 98.6 /100 | #82 | Exceptional 12.1% |
| Immigrants | Chile | 98.6 /100 | #83 | Exceptional 12.1% |
| Immigrants | Czechoslovakia | 98.6 /100 | #84 | Exceptional 12.1% |
| Turks | 98.5 /100 | #85 | Exceptional 12.1% |
| Immigrants | Israel | 98.5 /100 | #86 | Exceptional 12.1% |
| South Americans | 98.5 /100 | #87 | Exceptional 12.1% |
| Immigrants | Eritrea | 98.5 /100 | #88 | Exceptional 12.1% |
| Immigrants | Ireland | 98.3 /100 | #89 | Exceptional 12.1% |
| South American Indians | 98.3 /100 | #90 | Exceptional 12.1% |
| Immigrants | Turkey | 98.2 /100 | #91 | Exceptional 12.1% |
| Spanish American Indians | 98.0 /100 | #92 | Exceptional 12.1% |
| Immigrants | Bosnia and Herzegovina | 97.9 /100 | #93 | Exceptional 12.1% |
| Colombians | 97.8 /100 | #94 | Exceptional 12.2% |
| Mongolians | 97.7 /100 | #95 | Exceptional 12.2% |