Immigrants from Turkey vs Jordanian Single Male Poverty
COMPARE
Immigrants from Turkey
Jordanian
Single Male Poverty
Single Male Poverty Comparison
Immigrants from Turkey
Jordanians
12.1%
SINGLE MALE POVERTY
98.2/ 100
METRIC RATING
91st/ 347
METRIC RANK
12.3%
SINGLE MALE POVERTY
95.9/ 100
METRIC RATING
105th/ 347
METRIC RANK
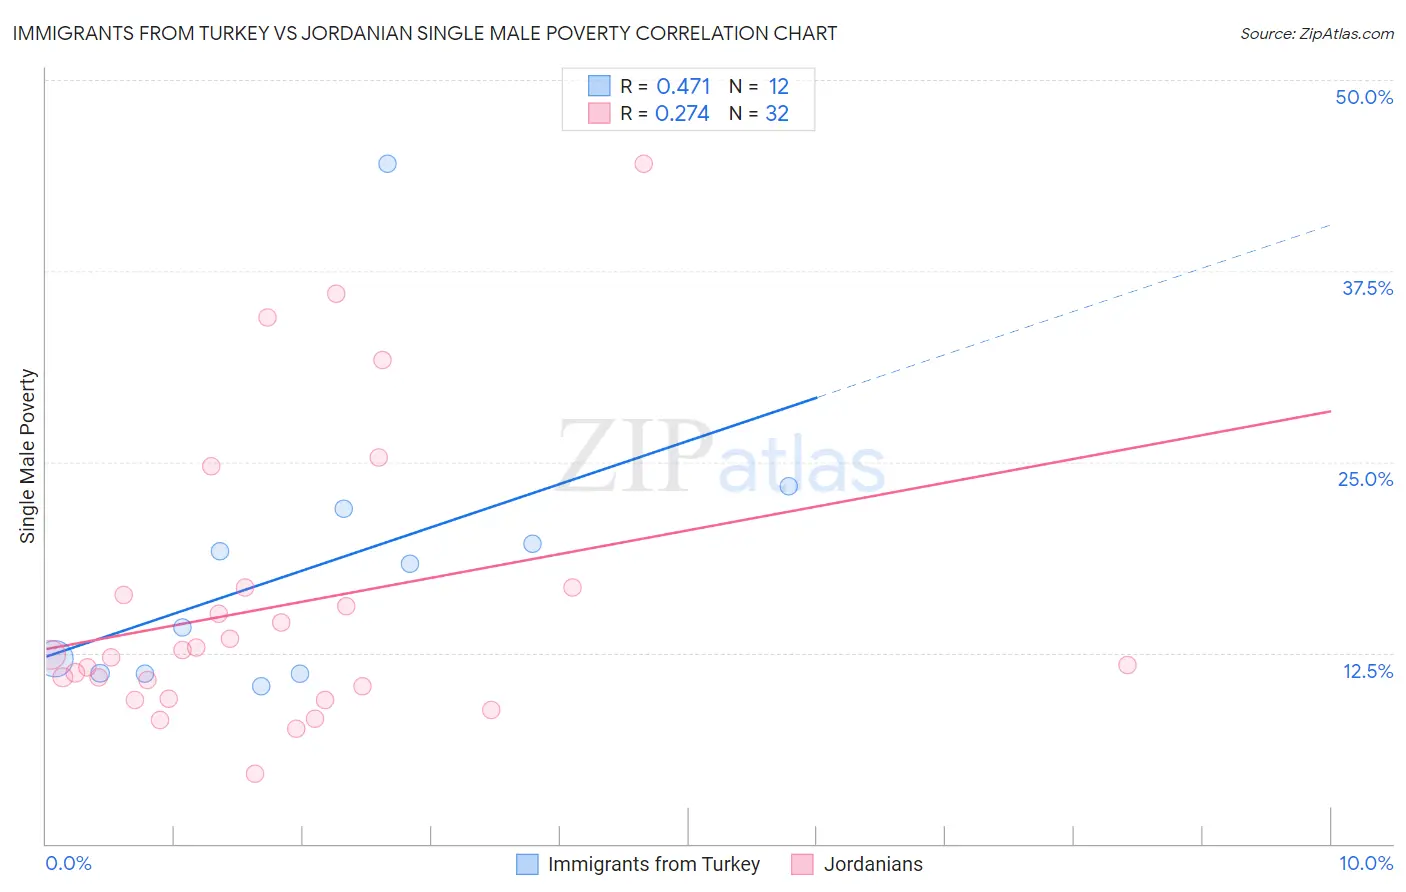
Immigrants from Turkey vs Jordanian Single Male Poverty Correlation Chart
The statistical analysis conducted on geographies consisting of 203,227,813 people shows a moderate positive correlation between the proportion of Immigrants from Turkey and poverty level among single males in the United States with a correlation coefficient (R) of 0.471 and weighted average of 12.1%. Similarly, the statistical analysis conducted on geographies consisting of 156,040,584 people shows a weak positive correlation between the proportion of Jordanians and poverty level among single males in the United States with a correlation coefficient (R) of 0.274 and weighted average of 12.3%, a difference of 1.2%.
Single Male Poverty Correlation Summary
| Measurement | Immigrants from Turkey | Jordanian |
| Minimum | 10.3% | 4.6% |
| Maximum | 44.5% | 44.5% |
| Range | 34.2% | 39.9% |
| Mean | 18.1% | 15.6% |
| Median | 16.2% | 12.3% |
| Interquartile 25% (IQ1) | 11.1% | 9.9% |
| Interquartile 75% (IQ3) | 20.8% | 16.5% |
| Interquartile Range (IQR) | 9.6% | 6.6% |
| Standard Deviation (Sample) | 9.5% | 9.3% |
| Standard Deviation (Population) | 9.1% | 9.2% |
Demographics Similar to Immigrants from Turkey and Jordanians by Single Male Poverty
In terms of single male poverty, the demographic groups most similar to Immigrants from Turkey are South American Indian (12.1%, a difference of 0.050%), Immigrants from Ireland (12.1%, a difference of 0.060%), Spanish American Indian (12.1%, a difference of 0.11%), Immigrants from Bosnia and Herzegovina (12.1%, a difference of 0.17%), and Immigrants from Eritrea (12.1%, a difference of 0.23%). Similarly, the demographic groups most similar to Jordanians are Immigrants from Morocco (12.3%, a difference of 0.080%), Iraqi (12.3%, a difference of 0.26%), Immigrants from Eastern Africa (12.3%, a difference of 0.28%), Immigrants from Kazakhstan (12.2%, a difference of 0.32%), and Immigrants from Armenia (12.2%, a difference of 0.33%).
| Demographics | Rating | Rank | Single Male Poverty |
| Immigrants | Eritrea | 98.5 /100 | #88 | Exceptional 12.1% |
| Immigrants | Ireland | 98.3 /100 | #89 | Exceptional 12.1% |
| South American Indians | 98.3 /100 | #90 | Exceptional 12.1% |
| Immigrants | Turkey | 98.2 /100 | #91 | Exceptional 12.1% |
| Spanish American Indians | 98.0 /100 | #92 | Exceptional 12.1% |
| Immigrants | Bosnia and Herzegovina | 97.9 /100 | #93 | Exceptional 12.1% |
| Colombians | 97.8 /100 | #94 | Exceptional 12.2% |
| Mongolians | 97.7 /100 | #95 | Exceptional 12.2% |
| Immigrants | Sweden | 97.5 /100 | #96 | Exceptional 12.2% |
| Immigrants | Italy | 97.4 /100 | #97 | Exceptional 12.2% |
| Guamanians/Chamorros | 97.4 /100 | #98 | Exceptional 12.2% |
| Immigrants | Cuba | 97.3 /100 | #99 | Exceptional 12.2% |
| Immigrants | Australia | 97.1 /100 | #100 | Exceptional 12.2% |
| Immigrants | Latvia | 97.0 /100 | #101 | Exceptional 12.2% |
| Immigrants | Europe | 97.0 /100 | #102 | Exceptional 12.2% |
| Immigrants | Armenia | 96.7 /100 | #103 | Exceptional 12.2% |
| Immigrants | Kazakhstan | 96.7 /100 | #104 | Exceptional 12.2% |
| Jordanians | 95.9 /100 | #105 | Exceptional 12.3% |
| Immigrants | Morocco | 95.6 /100 | #106 | Exceptional 12.3% |
| Iraqis | 95.1 /100 | #107 | Exceptional 12.3% |
| Immigrants | Eastern Africa | 95.0 /100 | #108 | Exceptional 12.3% |