Immigrants from Turkey vs German Russian Single Male Poverty
COMPARE
Immigrants from Turkey
German Russian
Single Male Poverty
Single Male Poverty Comparison
Immigrants from Turkey
German Russians
12.1%
SINGLE MALE POVERTY
98.2/ 100
METRIC RATING
91st/ 347
METRIC RANK
13.6%
SINGLE MALE POVERTY
0.8/ 100
METRIC RATING
253rd/ 347
METRIC RANK
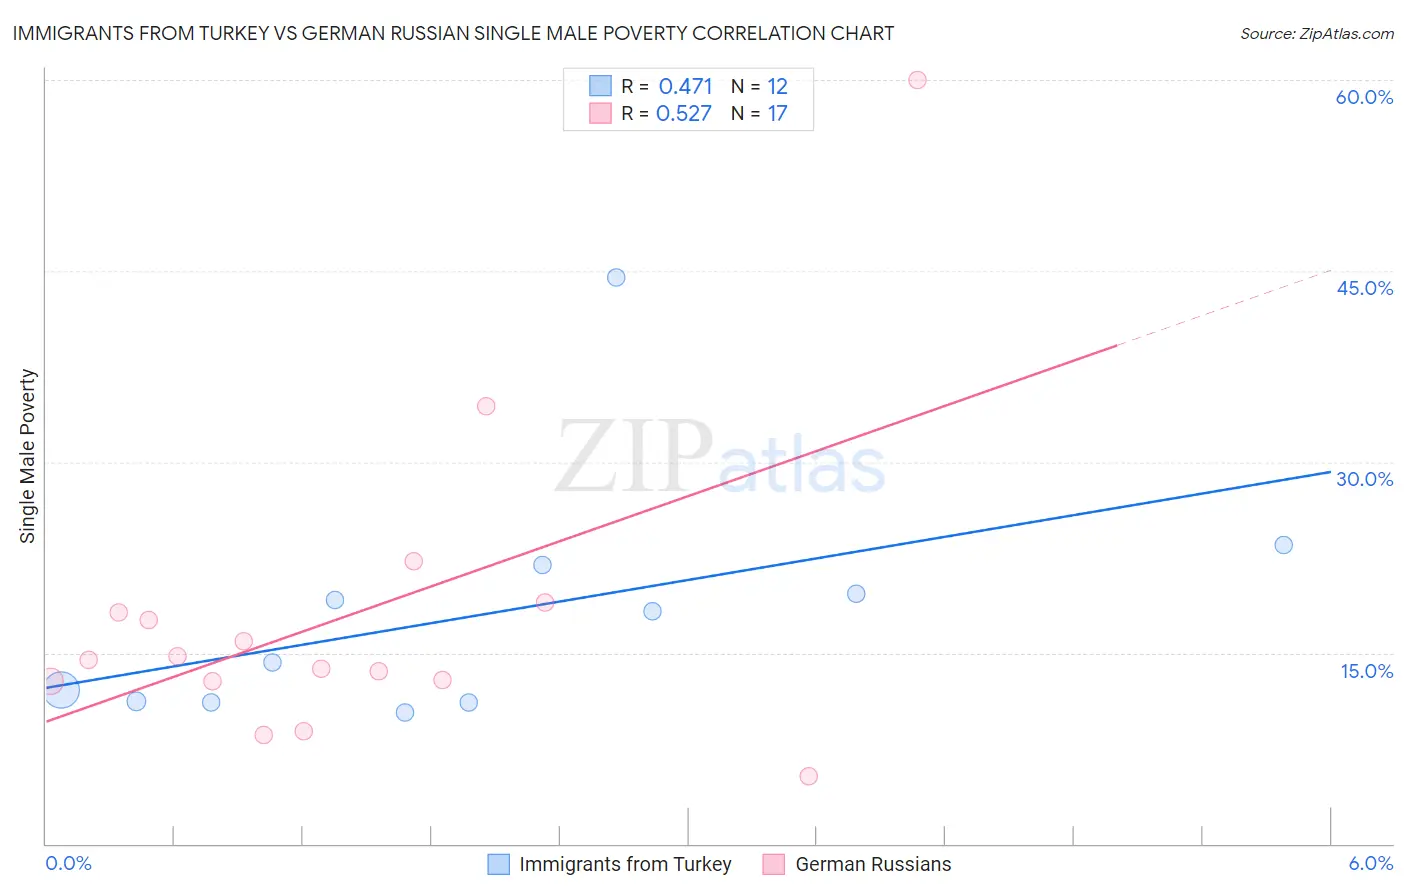
Immigrants from Turkey vs German Russian Single Male Poverty Correlation Chart
The statistical analysis conducted on geographies consisting of 203,227,813 people shows a moderate positive correlation between the proportion of Immigrants from Turkey and poverty level among single males in the United States with a correlation coefficient (R) of 0.471 and weighted average of 12.1%. Similarly, the statistical analysis conducted on geographies consisting of 92,578,425 people shows a substantial positive correlation between the proportion of German Russians and poverty level among single males in the United States with a correlation coefficient (R) of 0.527 and weighted average of 13.6%, a difference of 12.3%.
Single Male Poverty Correlation Summary
| Measurement | Immigrants from Turkey | German Russian |
| Minimum | 10.3% | 5.3% |
| Maximum | 44.5% | 60.0% |
| Range | 34.2% | 54.7% |
| Mean | 18.1% | 17.9% |
| Median | 16.2% | 14.4% |
| Interquartile 25% (IQ1) | 11.1% | 12.8% |
| Interquartile 75% (IQ3) | 20.8% | 18.6% |
| Interquartile Range (IQR) | 9.6% | 5.8% |
| Standard Deviation (Sample) | 9.5% | 12.6% |
| Standard Deviation (Population) | 9.1% | 12.2% |
Similar Demographics by Single Male Poverty
Demographics Similar to Immigrants from Turkey by Single Male Poverty
In terms of single male poverty, the demographic groups most similar to Immigrants from Turkey are South American Indian (12.1%, a difference of 0.050%), Immigrants from Ireland (12.1%, a difference of 0.060%), Spanish American Indian (12.1%, a difference of 0.11%), Immigrants from Bosnia and Herzegovina (12.1%, a difference of 0.17%), and Immigrants from Eritrea (12.1%, a difference of 0.23%).
| Demographics | Rating | Rank | Single Male Poverty |
| Immigrants | Czechoslovakia | 98.6 /100 | #84 | Exceptional 12.1% |
| Turks | 98.5 /100 | #85 | Exceptional 12.1% |
| Immigrants | Israel | 98.5 /100 | #86 | Exceptional 12.1% |
| South Americans | 98.5 /100 | #87 | Exceptional 12.1% |
| Immigrants | Eritrea | 98.5 /100 | #88 | Exceptional 12.1% |
| Immigrants | Ireland | 98.3 /100 | #89 | Exceptional 12.1% |
| South American Indians | 98.3 /100 | #90 | Exceptional 12.1% |
| Immigrants | Turkey | 98.2 /100 | #91 | Exceptional 12.1% |
| Spanish American Indians | 98.0 /100 | #92 | Exceptional 12.1% |
| Immigrants | Bosnia and Herzegovina | 97.9 /100 | #93 | Exceptional 12.1% |
| Colombians | 97.8 /100 | #94 | Exceptional 12.2% |
| Mongolians | 97.7 /100 | #95 | Exceptional 12.2% |
| Immigrants | Sweden | 97.5 /100 | #96 | Exceptional 12.2% |
| Immigrants | Italy | 97.4 /100 | #97 | Exceptional 12.2% |
| Guamanians/Chamorros | 97.4 /100 | #98 | Exceptional 12.2% |
Demographics Similar to German Russians by Single Male Poverty
In terms of single male poverty, the demographic groups most similar to German Russians are Finnish (13.6%, a difference of 0.14%), Immigrants from Zaire (13.6%, a difference of 0.19%), Immigrants from Somalia (13.6%, a difference of 0.30%), Spanish (13.6%, a difference of 0.32%), and Czech (13.5%, a difference of 0.56%).
| Demographics | Rating | Rank | Single Male Poverty |
| Immigrants | Micronesia | 1.2 /100 | #246 | Tragic 13.5% |
| Belgians | 1.2 /100 | #247 | Tragic 13.5% |
| Czechs | 1.2 /100 | #248 | Tragic 13.5% |
| Spanish | 1.0 /100 | #249 | Tragic 13.6% |
| Immigrants | Somalia | 1.0 /100 | #250 | Tragic 13.6% |
| Immigrants | Zaire | 0.9 /100 | #251 | Tragic 13.6% |
| Finns | 0.9 /100 | #252 | Tragic 13.6% |
| German Russians | 0.8 /100 | #253 | Tragic 13.6% |
| Sub-Saharan Africans | 0.5 /100 | #254 | Tragic 13.7% |
| Spaniards | 0.4 /100 | #255 | Tragic 13.7% |
| Immigrants | Belize | 0.4 /100 | #256 | Tragic 13.7% |
| Immigrants | Central America | 0.3 /100 | #257 | Tragic 13.8% |
| Immigrants | Guatemala | 0.3 /100 | #258 | Tragic 13.8% |
| Guatemalans | 0.3 /100 | #259 | Tragic 13.8% |
| Swiss | 0.3 /100 | #260 | Tragic 13.8% |